
. INTRODUCTION
Precise and accurate dating of fluvial deposits is essential to understand floodplain evolution during the Holocene. Although radiocarbon dating has been commonly used to reconstruct floodplain evolution (Aslan and Autin, 1999; Berendsen and Stouthamer, 2000; Funabiki et al., 2012), its reliability and applicability are restricted by potential reworking and scarcity of organic materials in fluvial sediments (Ishii et al., 2016; Ishii, 2017, 2018). In contrast, optically stimulated luminescence (OSL) can be applied directly to quartz and feldspar grains, the main components of fluvial deposits, and provides an alternative way for establishing floodplain chronology. Previous studies have successfully applied OSL dating to fluvial deposits, although the luminescence signals of water-lain sediments are often incompletely zeroed prior to deposition due to the limited exposure to sunlight (Rittenour et al., 2008).
Quartz sand grains are generally used for the OSL dating of fluvial deposits because (1) incomplete bleaching can be detected from the dose distribution of small aliquots or single grains (Wallinga, 2002), and (2) coarser grains are better bleached in many cases, possibly because of longer residence time on the riverbed and sunlight exposure on channel bars (Olley et al., 1998; Truelsen and Wallinga, 2003; Rittenour, 2008; Avni et al., 2010; Thompson et al., 2018). Furthermore, accurate ages can be obtained in combination with statistical methods such as minimum age model (MMA; Galbraith et al., 1999). Application of OSL dating to fine-grained (4–11 μm) fluvial sediments has been limited, but recent studies have demonstrated that fine-grained quartz is sufficiently bleached in large river systems (Hu et al., 2010; Shen and Mauz, 2012; Chamberlain et al., 2017). Hu et al. (2010) measured small residual doses (0.6–1.6 Gy) from fine-grained quartz from suspended sediment in the middle reach of the Yellow River despite the high turbidity limiting sunlight exposure of water-lain sediments. Shen and Mauz (2012) reported that the fine-grained quartz has small residual doses equivalent to ca. 100 a in the Mississippi Delta. Chamberlain et al. (2017) demonstrated that the fine-grained quartz in the Ganges–Brahmaputra–Meghna Delta is sufficiently bleached before deposition and their OSL ages are consistent with independent age estimates for young (<500 yr) deposits. OSL dating of fine-grained fluvial deposits may have an underutilised potential for establishing an accurate chronology of mud-dominated floodplain evolution.
The Mekong River is one of the largest river systems in the world, with a large sediment discharge comparable to other larger Asian river systems such as Yellow and Ganges–Brahmaputra rivers. In Cambodia, the river is actively migrating and characterised by a series of abandoned, mud-dominated, inner bank levees upstream of Phnom Penh (Fig. 1). However, the chronology and evolution of this channel-levee system are poorly constrained. The aims of this paper are twofold: (1) to assess the degree of bleaching of fluvial deposits in a very young (<600 yr) point bar to natural levee facies succession, by comparing multi-grain and single grain measurements of quartz OSL and feldspar or polymineral infrared stimulated luminescence (IRSL) for a range of grain size fractions; and (2) discuss the development of natural levee.
Fig. 1
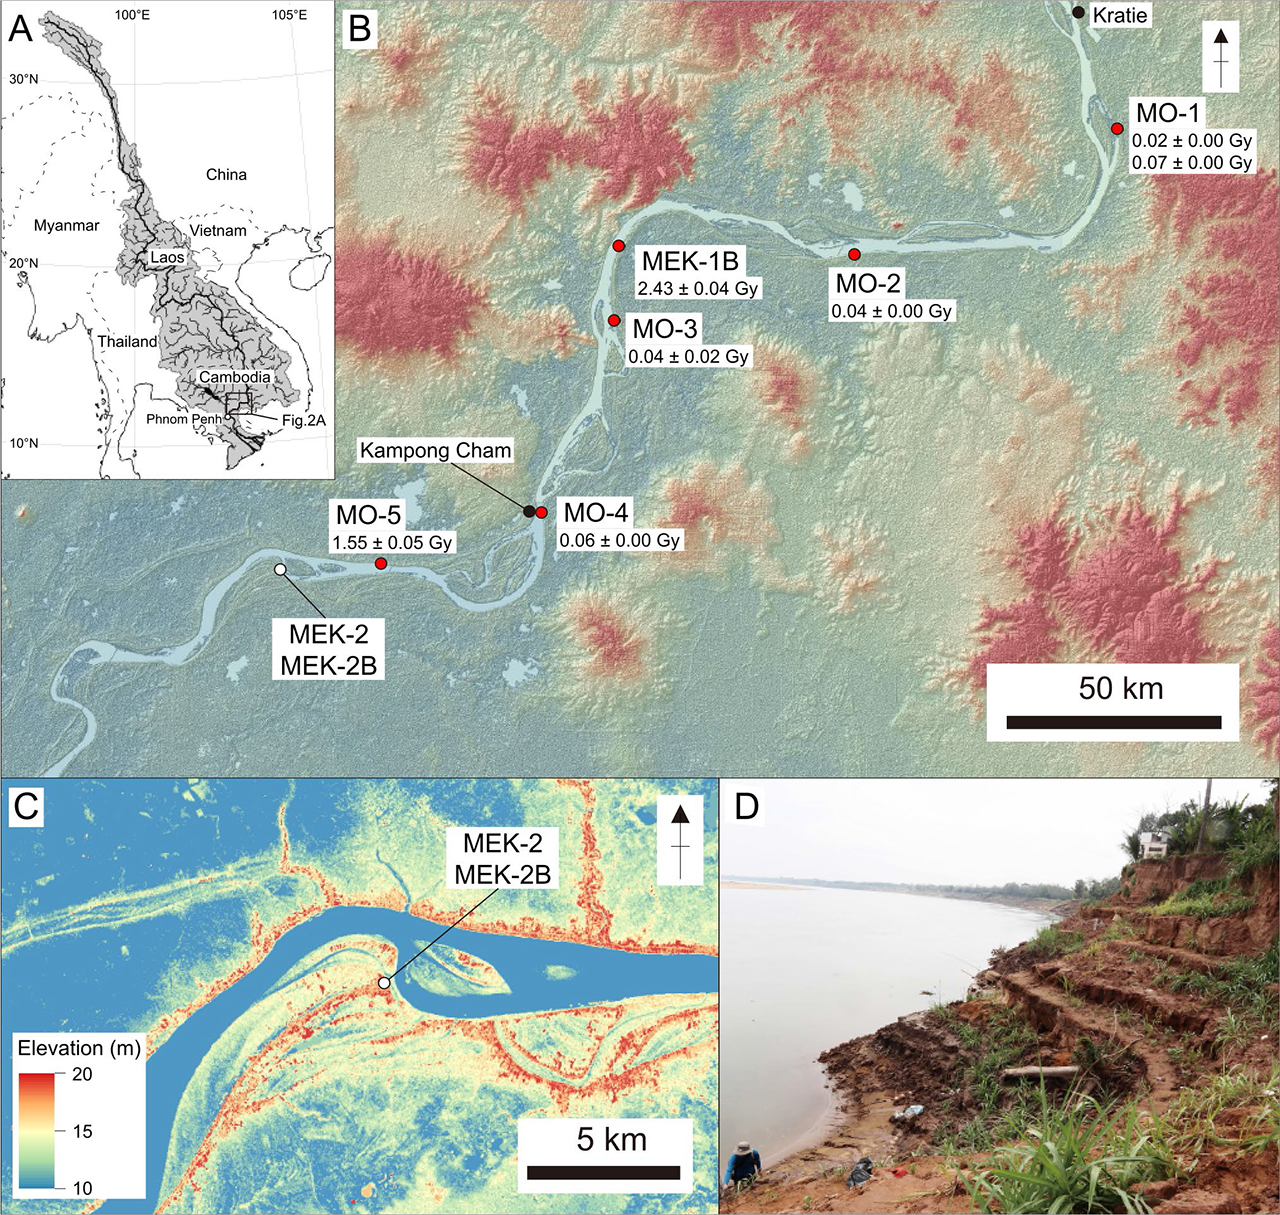
(A) Map showing the drainage basin (shaded) of the Mekong River. (B) Relief map of the study area. Sampling locations for the modern flood sediments are shown by red circles, which are labelled with the residual doses of fine-grained quartz samples. The white circle represents the location of MEK-2 and MEK-2B. (C) Digital Surface Model (DSM) around the MEK-2 and MEK-2B sites. The DSM used is ALOS World 3D – 30 m (AW3D30), released from the Japan Aerospace Exploration Agency (JAXA). (D) Photograph of the section at site MEK-2B.
. REGIONAL SETTINGS
The Mekong River originates from the Tibetan Plateau and flows approximately 4000 km before entering the alluvial lowland downstream of Kratie, Cambodia (Fig. 1; Gupta and Liew, 2007). The river debouches into the South China Sea after flowing a further 600 km through the alluvial and delta plain. The catchment area of the river is 795,000 km2 (Gupta and Liew, 2007). The water and sediment discharge is estimated at 475 km3 (Mekong River Commission, 2009) and 160×106 t/yr (Milliman and Meade, 1983), respectively. The sediment discharge is tenth largest in the world (Milliman and Syvitski, 1992), approximately 90% of which comes from the upstream areas in China, Laos and Vietnam (Clift et al., 2004).
The drainage basin of the Mekong River is mainly located in the Indian monsoon region (Wang et al., 2003), and most of the precipitation occurs during the summer monsoon season (May–October). The annual average rainfalls are variable across the drainage basin, ranging from less than 1,000 mm in the eastern part of Thailand to more than 3,000 mm in mountainous areas in Laos (Mekong River Commission, 2010). In Cambodia, the Mekong River water level shows strong seasonal variability due to the monsoon climate. Based on the average monthly water discharge between 1960 to 2004, the river water level starts to increase in June and peaks from August to September (Mekong River Commission, 2009). Tropical storms and cyclones also bring heavy rain to the area in August to October and occasionally cause severe floods. About 75% of the annual discharge (475 km3) occurs between July and October (Mekong River Commission, 2010).
In southern Cambodia, rapid floodplain aggradation occurred in the Mekong River delta during the sea-level rise from 8.4–10 ka and mangrove forests were established between 6.3–8.4 ka (Tamura et al., 2009). The mangrove coast then shifted downstream, but fluvial sedimentation was minimal until 1 ka (Tamura et al., 2009). A relative sea-level highstand around 6 ka is inferred to have been 2.5–4.5 m higher than the present sea level (Nguyen et al., 2000), and geophysical modelling suggests that the subsequent relative sea-level fall resulted from crustal uplift due to hydro-isostatic effects (Hanebuth et al. 2012).
Between Kampong Cham to Phnom Penh, the flood-plain is 10–20 km wide and abandoned natural levees due to channel migration occur frequently (Fig. 1). The river meandering appears to be restricted where the river channel is constrained by terraces. Radiocarbon ages obtained from the levee deposits suggests that the oldest levees date back to at least ca. 5000 cal yr BP (Oketani and Haruyama, 2011).
. MATERIAL AND METHODS
Sample collection
During February 2018, a ca. 6 m thick succession of heterolithic point-bar deposits was investigated at a riverbank outcrop (MEK-2B) ca. 60 km upstream from Phnom Penh (Fig. 1). Four sand samples and two mud samples were obtained for OSL analysis by hammering PVC tubes into cleaned sections. Samples for grain-size analysis were also collected at the same stratigraphic levels. An auger core, MEK-2, was obtained 40 m from the outcrop on the adjacent natural levee. Sediments were sampled from the auger head every 0.1–0.4 m interval for grain-size analysis and measurement of water content. OSL samples were collected at an interval of ca. 1 m by hammering light-tight stainless tubes at the bottom of the auger hole and were dominated by mud.
Samples of modern flood deposits were collected at six sites in September 2018, just after the monsoon flooding, to examine the residual doses of fluvial deposits (Fig. 1B). Modern flood deposits are clearly distinguished from underlying layers with the absence of plant roots and contrast in consolidation. Equivalent doses (De) obtained from modern deposits are regarded as residual doses because they should yield a zero De when completely bleached. Such residual doses may potentially lead to an overestimation but were not considered for the determination of the ages of MEK-2 and MEK-2B. Sites MO-1, MEK-1B, MO-3, and MO-4 are located on natural levees, and the sediments are interpreted to be deposited from overbank floods. Flood deposits were also observed on bars at the entrances of crevasse channels (sites MO-2 and MO-5). Sediments were collected by hammering PVC tubes into cleaned sections where possible. Thin mud layers deposited on the ground surface (samples gsj18320, gsj18321, gsj18325, gsj18326, and gsj18330) were collected with a spoon and preserved in light-tight bags.
Grain size analysis
A laser diffraction particle size analyser (SALD-3000J, Shimadzu Corporation, Japan) was used to obtain the grain-size distribution of sediment samples. A sub-sample of 0.1–0.2 g was treated with 10% H2O2 to remove organic matter. The samples were placed in an ultrasonic bath for 10 minutes prior to analysis to disperse the aggregates. The median grain size was determined from the grain-size distribution.
OSL sample preparation and measurement
OSL samples were processed under subdued red light to avoid the loss of luminescence signals. Sediments within 20–25 mm from each end of the sample tubes were used for measurements of water content and dosimetry. The rest of the samples were treated with 10% HCl and 10% H2O2 to remove carbonate and organic matter, and after that, sand-sized samples were sieved to obtain different grain size fractions. Sand-sized quartz and feldspar grains were separated using sodium polytungstate liquids to extract quartz-rich fraction (2.58–2.70 g/cm3) and K-feldspar fraction (2.53–2.58 g/cm3). The quartz-rich fraction was etched with 40% HF for 1 h, to eliminate feldspar contamination and remove the outer portion of the quartz grains, and then treated with 10% HCl. The etched grains were re-sieved to remove any remaining small feldspar grains. The fine-grained (4–11 μm) fractions were separated using Stokes’ Law. Polymineral fine grains were treated with H2SiF6 for four days to dissolve feldspars, followed by 10% HCl treatment to obtain quartz grains. Three aliquots per sample were checked for feldspar contamination with IRSL. All quartz samples showed <10% OSL depletion after IRSL and thus are considered to be successfully purified.
Luminescence measurements were made with an automated Risø TL/OSL DA-20 reader. The blue-light (∼470 nm) stimulated signal from quartz samples were detected through a 7.5 mm Hoya U-340 filter. The infrared-light (∼875 nm) stimulated signal from feldspar, or fine-grained polymineral samples were detected through a combination of Schott BG3 (3 mm thick), BG39 (2 mm), and GG400 (3 mm) filters. Small (2 mm) aliquots were used for sand-sized quartz samples to examine the De variations, and large (6 mm) aliquots were used for feldspar and fine-grained samples. Single-grain measurements were also conducted for samples gsj18032 and gsj18034 using a single-grain OSL attachment. Optical stimulation of single grain quartz was achieved using a green (532 nm) laser.
The single-aliquot regenerative-dose (SAR) protocol (Murray and Wintle, 2000) was used for quartz OSL measurements, and modified SAR protocols based on Buylaert et al. (2009) for IRSL and post-IR IRSL measurements of feldspar and polymineral samples (Table 1; Fig. 2). Quartz OSL measurements were made at 125°C with a stimulation time of 20 s. For the multi-grain quartz measurements, the luminescence signal was integrated over the first 0.5 s, and the background signal was integrated between 0.5 and 1.3 s (Cunningham and Wallinga, 2010). For the single-grain measurements, the signal was integrated over the first 0.05 s, and the background was calculated over the final 0.5 s. IRSL and post-IR IRSL measurements were made for 100 s at 50°C (IR50), and 150°C (pIRIR150), respectively, and the signals were integrated over the first 2 s and subtracted with the background integrated over the last 20 s. Twenty replicates per sample were measured for sand-sized quartz, and six replicates per sample were measured for feldspar and fine-grained samples. Aliquots were rejected if the recycling ratio was not consistent with 1.0 ± 0.1. For the single-grain measurements, grains with IR depletion ratios (Duller, 2003) outside 1.0 ± 0.1 were also rejected.
Fig. 2
Examples of decay curves and dose-response curves (insets) for (A) fine-grained quartz, (B) IR50 of polymineral fine grains, (C) pIRIR150 of polymineral fine grains, and (D) pIRIR150 of K-feldspars. White points in the insets denote recycling points.
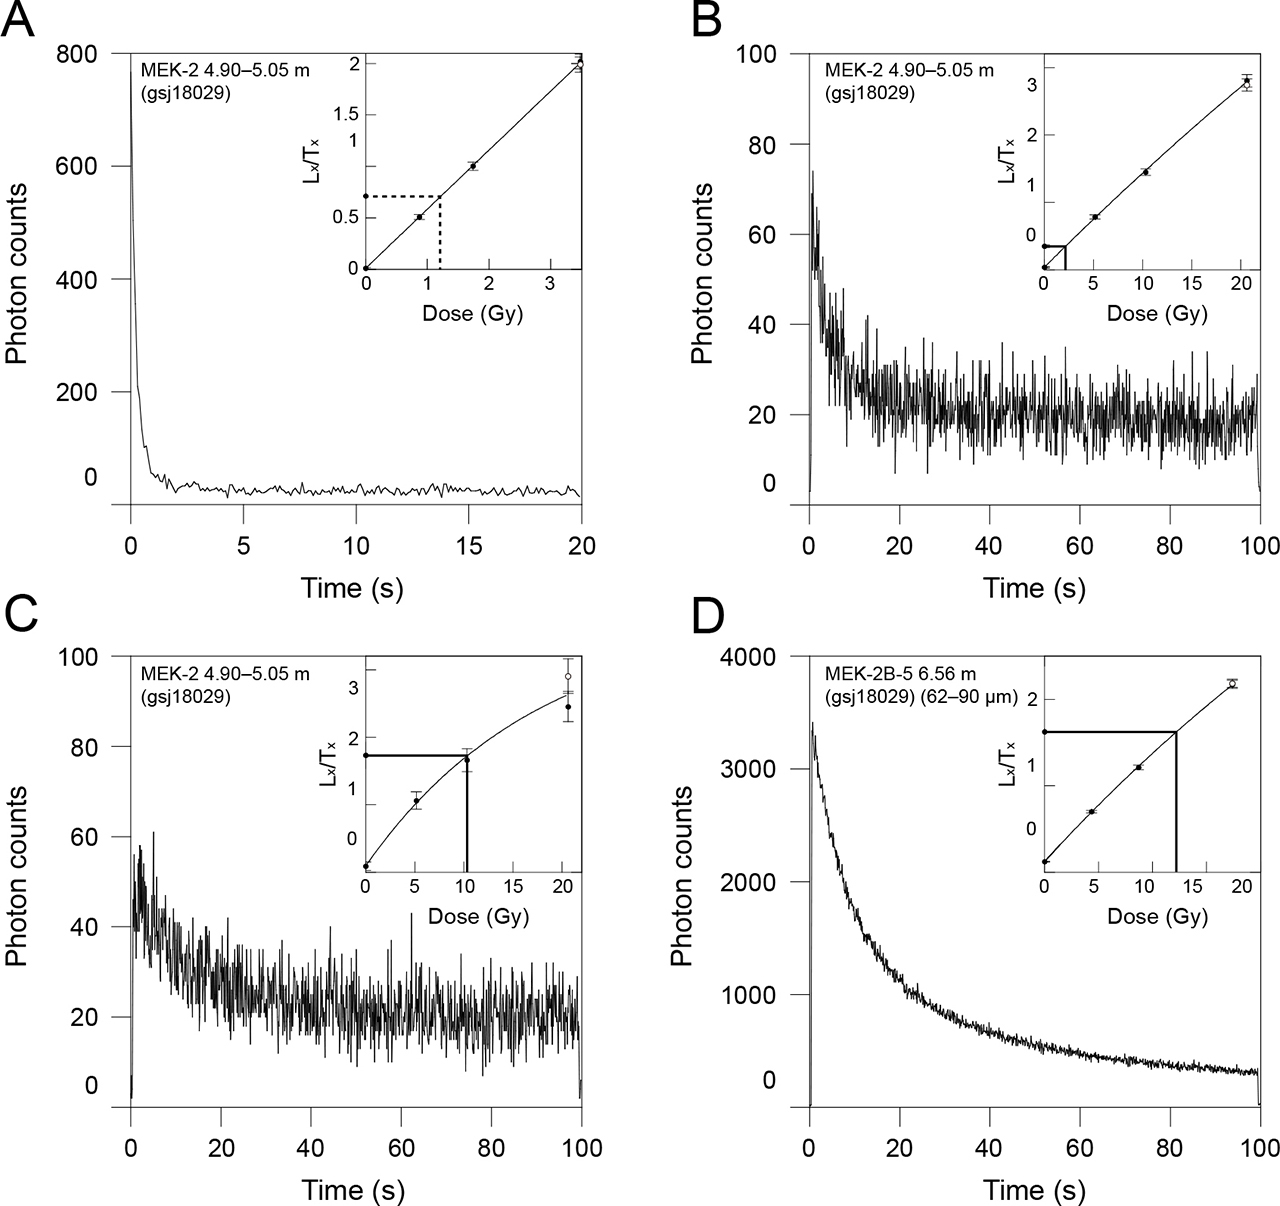
Table 1
Summaries of OSL, IRSL and post-IR IRSL SAR protocols used in this study.
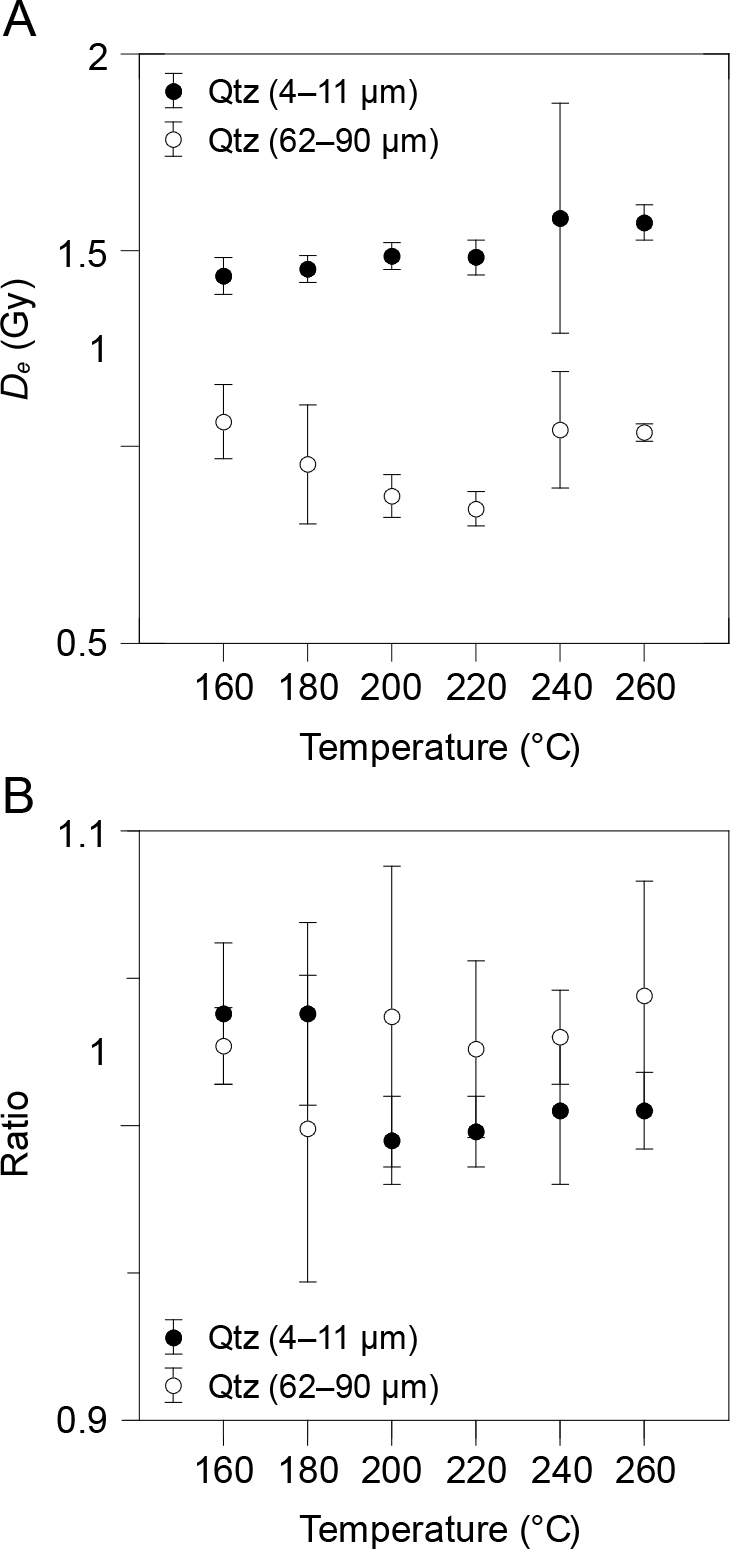
Preheat plateau and dose recovery tests on quartz sand (gsj18032) and fine-grained samples (gsj18031) were performed (Fig. 3). The preheat temperature of quartz sand and fine-grained quartz was set to 220 and 200°C, respectively. Dose recovery ratios of IR50 and pIRIR150 at a preheat temperature of 180°C were assessed on feldspar sand (gsj18032) and fine-grained polyminerals (gsj18031). Six aliquots for each feldspar sample were bleached for 4 h under artificial sunlight (Hönle SOL2 solar simulator) and three aliquots for each sample were subsequently given doses of 17.4 Gy. The measured-to-given dose ratios are within 10% of unity after subtraction of the residual doses obtained from the other three aliquots.
Fig. 3
(A) Preheat plateau tests and (B) preheat dose recovery tests for samples gsj18031 (4–11 μm) and gsj18032 (62–90 μm).
To examine the bleaching rates for OSL and IR50 signals, 14 batches comprising three aliquots of quartz and feldspar sands (gsj18034), and quartz and polymineral fine grains (gsj18033) were bleached under artificial sunlight for different durations. The sensitivity-corrected light intensity of bleached aliquot was normalised using the average of the three natural aliquots.
The environmental dose rate was calculated with DRAC of Durcan et al. (2015) (Table 2). The concentrations of uranium, thorium, potassium, and rubidium were obtained by inductively coupled plasma mass spectrometry, and the dose rates were derived using the conversion factors of Adamiec and Aitken (1998). The beta and alpha dose attenuation were corrected for grain size following Mejdahl (1979) and Bell (1980). Alpha efficiencies of 0.15 ± 0.05, 0.038 ± 0.002, and 0.086 ± 0.004 were used for sand-sized K-feldspar (Balescu and Lamothe, 1994), fine-grained quartz (Rees-Jones, 1995) and polymineral fine grains (Rees-Jones, 1995), respectively. The cosmic-dose rate was calculated based on Prescott and Hutton (1994). The internal potassium content of K-feldspar was assumed to be 12.5 ± 0.5% (Huntley and Baril, 1997).
Table 2
Summary of dated samples and dosimetry data. The number of measured and accepted aliquots is shown. We added 5% to the water content values obtained from samples collected during dry season to account the seasonal changes. The “Q”, “F”, and “P” denotes quartz, K-feldspar, and polymineral fine grains, respectively.
The OSL sample at 7.4 m depth (gsj18033) was taken from the midpoint of a mud layer 30 cm thick, so we calculated the gamma contributions from the over- and underlying layers using the principle of superposition (Aitken, 1985: Appendix H). The external infinite-matrix gamma dose rate of over- and underlying layers were determined using the values from upper and lower OSL samples (gsj18034 and gsj18032). Water contents of the three layers were averaged and used for calculation of water-content attenuation.
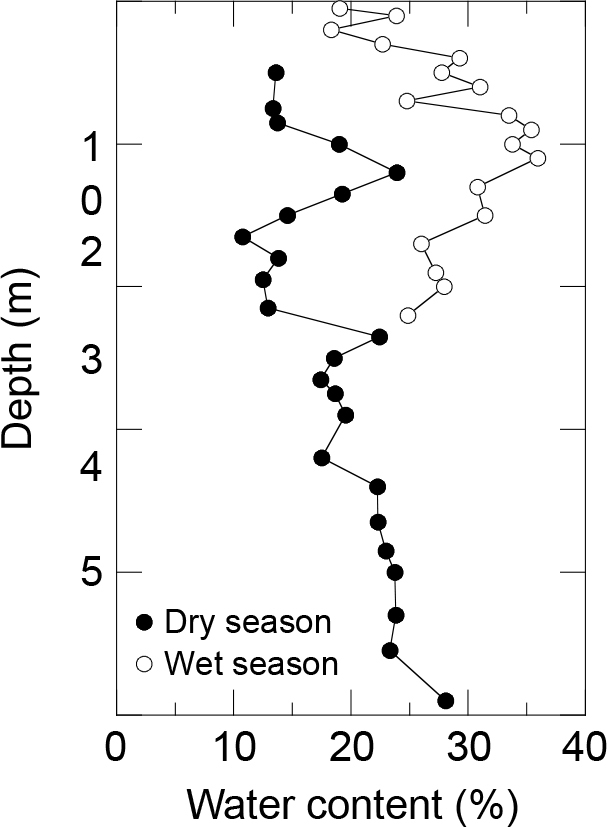
To investigate the difference in water content between wet and dry seasons, we collected samples near the site MEK-2B in September 2018. The water content in the dry season was ca. 10% lower than that in the wet season (Fig. 4). We added 5% to the measured water content values in the dry season, and an error of 5% was assumed to take into account the past variation in the dose rate calculation.
De and overdispersion values of multi-grain measurements were calculated using the central age model of Galbraith et al. (1999). Single-grain De values were also calculated using the minimum age model (Galbraith et al., 1999). The overdispersion values of 10% and 20% were used for calculating the minimum age model because well-bleached sand-sized quartz samples commonly have values of 10–20% (Arnold and Roberts, 2009; Galbraith and Roberts, 2012). The De value was divided by the dose rate to obtain a final age estimate. We did not take into account the potential residual dose in the age determination. All ages were expressed relative to AD 2018.
Laboratory fading rates (g2days-values) of IR50 were measured on aliquots that were used for De measurements, following Auclair et al. (2003). The mean g-values of K-feldspar samples (5.09 ± 0.18%/decade) and fine-grained polymineral samples (4.02 ± 0.11%/decade) were obtained, and the fading correction was performed following Huntley and Lamothe (2001) and using the function of R Luminescence Package (Kreutzer et al., 2012; Fuchs et al., 2015). The pIRIR150 ages of K-feldspar sample were not corrected for fading because the mean g-value is small (0.73 ± 0.04%/decade).
. RESULTS
Characteristics and interpretation of sediments
MEK-2 and MEK-2B
The section MEK-2B consists of basal ca. 6 m thick intercalation of sand and mud layers, overlain by ca. 4.5 m of reddish-brown mud deposits (Fig. 5). Sand layers above the basal layer are 10–120 cm thick and typically display sharp basal contacts. Interbedded mud layers are 20–50 cm thick and are typically homogenous with sharp contacts above sand layers. The basal sand layer is cross-bedded while overlying sand layers show both ripple cross lamination and planar lamination. Overall, the grain size of sand layers becomes finer upwards, but the layers become sandier upwards. These sedimentary characteristics and the location below natural levee at the inner part of the meander bend are consistent with point-bar deposition (e.g. Gugliotta et al., 2018).
Fig. 5
Sedimentary columns of sites MEK-2 and MEK-2B. Vertical grain size profile and age-depth plots are also shown. The OSL ages are shown with 1 σ errors. The age-depth model was constructed by Bacon software (Blaauw and Christen, 2011). The dashed line shows ‘best’ model from the weighted average age and the shaded area indicates the 95% confidence interval. The single-grain ages calculated using the minimum age model (10% overdispersion value) are shown.
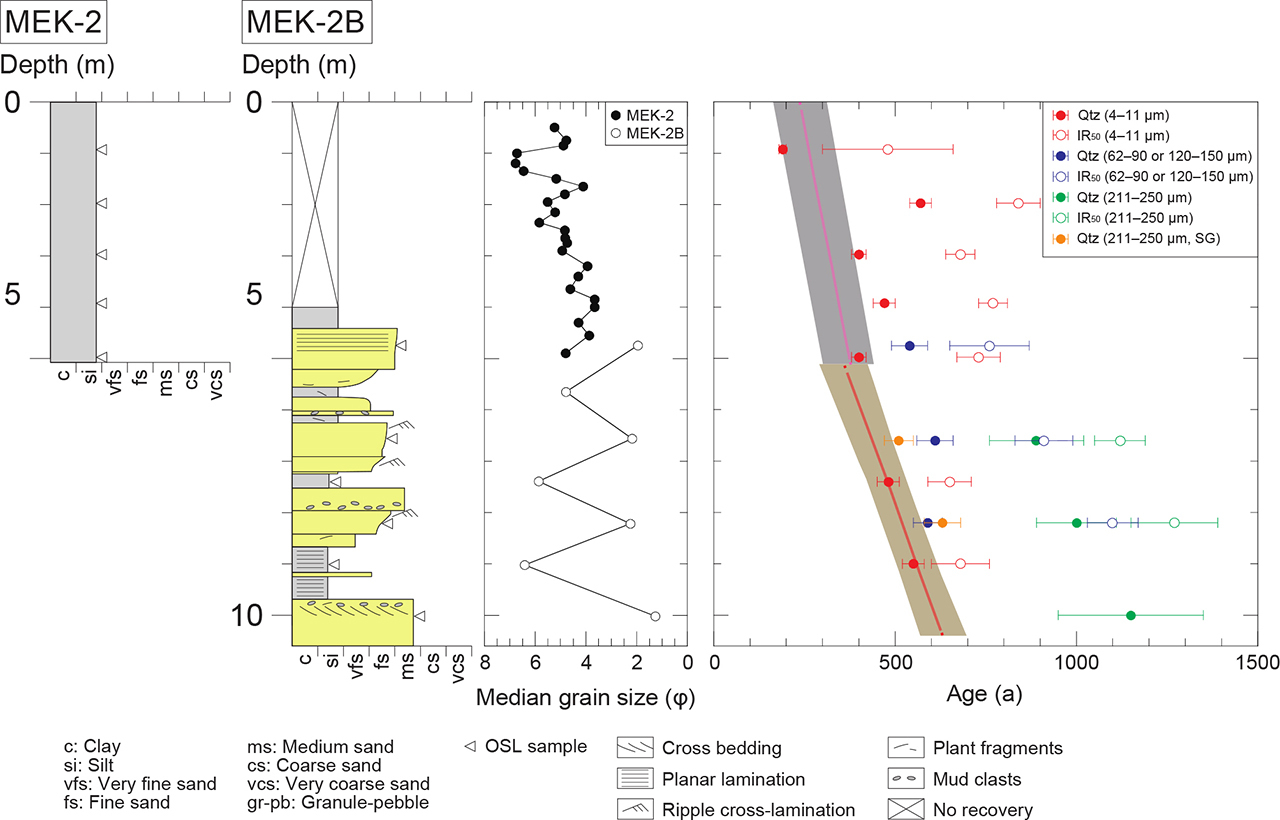
The auger core MEK-2, just 40 m from the MEK-2B outcrop, comprises ca. 5 m of apparently structureless, rooted, reddish-brown mud. The upper 4.5 m interval is consistent with MEK-2B, but the basal interval shows a lateral variation in facies, which is consistent with observed changes in layer thicknesses at MEK-2B. The median grain size in the reddish-brown mud at MEK-2 is generally finer than 4 φ and shows an overall fining-upward trend with peaks at 1.7 m and 0.5–0.9 m depths (Fig. 5). The dominance of mud, rooting, and the elevation and location of these deposits is consistent natural levee deposition (e.g. Gugliotta et al., 2018).
Modern flood deposits
A 1.5 cm thick, coarsening-upward silt layer was observed at site MO-1. Samples gsj18320 and gsj18321 were collected from the upper and lower halves of the layer, respectively. At site MO-2, a >30 cm thick, massive, fine-grained sand layer occurred on the bar and was apparently overlain by a ca. 10 cm thick silt layer on the lower part of the bar. A sample (gsj18322) was obtained from the sand layer at a section near the bar top, and samples gsj18323 and gsj18234 were obtained from the mud and underlying sand layers at a section on the lower part of the bar. Surface silt sediments were sampled at site MO-3 (gsj18325), but the facies and thickness of the fresh-flood deposits were not observed due to flooding. The section MO-4 consists of a >15 cm thick, upward-fining, medium to fine-grained sand layer (gsj18327) and an overlying 1–2 cm thick silt layer (gsj18326). A >15 cm thick, upward-coarsening, silty sand layer at site MO-5 was sampled at 4 cm (gsj18328) and 10 cm (gsj18329) depths from the surface. At site MEK-1B, we sampled a ca. 1 cm thick silt layer at the surface (gsj18330). All sampling locations of modern samples are open-air except at MEK-1B, which was shaded by dense trees.
Age estimates
The quartz OSL ages obtained from 62–90 μm fractions of sand at 6.6 m and 8.2 m depth (gsj18034, 18032) are 610 ± 50 and 590 ± 40 a, respectively (Fig. 5; Table 3). These ages are younger than the ages obtained from 211–250 μm fractions of sand (Table 3). The detailed comparison of different grain size fractions of sand (gsj18034) demonstrates that the finer fractions of sand have smaller De and thus are considered to be better bleached than the coarser fractions (Fig. 6). Although the De distribution of the 62–90 μm fractions shows a narrower peak in the low dose region (Fig. 7), a tail in the high dose region may indicate that at least some aliquots contain partially bleached grains.
Fig. 6
Quartz equivalent doses obtained from different grain size fractions of sand sample (gsj18034).
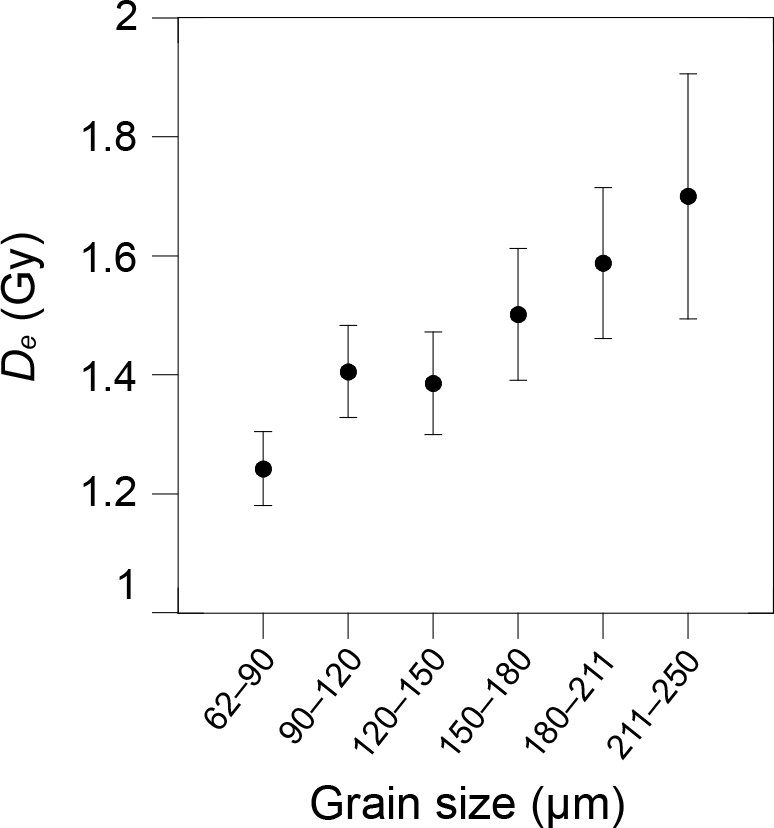
Fig. 7
Frequency distribution of equivalent doses obtained from multi-grain measurements of (A) 62–90 μm fractions and (B) 211–250 μm fractions of gsj18034, and (C) single-grain measurements of 211–250 μm fractions of gsj18034.
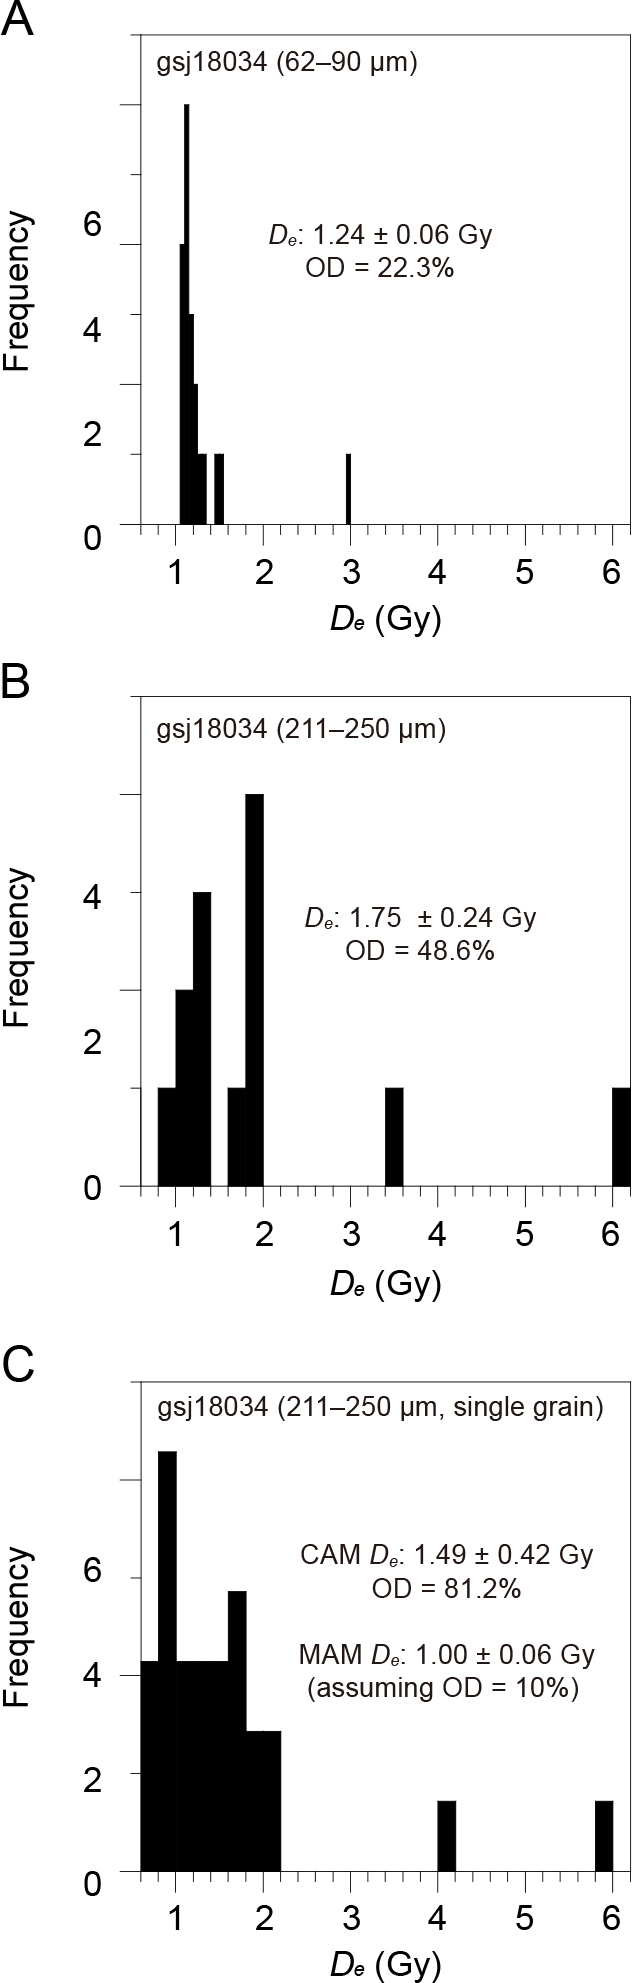
Table 3
Luminescence ages obtained from point-bar and natural levee deposits. “OD” is overdispersion value of quartz sample calculated using central age model. OSL ages with errors exceeding 10 a are rounded to the nearest decade.
In the single-grain measurements, we measured 2400 grains for samples gsj18034 and 18032, respectively. Only ca. 1% of the grains were accepted after the application of rejection criteria (Table 4). The single-grain De distributions have positive skewness as observed in the multi-grain measurements (Fig. 7). The overdispersion values are 96.3 and 81.2%, which are higher than those of multi-grain measurements because the values of multi-grain measurements are averaged within aliquots (38.2 and 48.6%; Tables 3 and 4). The ages calculated using the central age model are consistent with those from multi-grain measurements (Tables 3 and 4). The single-grain minimum age from gsj18032 using an overdispersion value of 10% is 630 ± 50 a, which is very similar to the age calculated using an overdispersion value of 20% (650 ± 60 a; Table 4). The minimum ages from gsj18034 are susceptible to the overdispersion values: 510 ± 40 and 590 ± 50 a for overdispersion values of 10% and 20%, respectively.
Table 4
Results of single-grain measurements. The number of measured and accepted grains is shown. The ages were calculated using central age model (CAM) and minimum age model (MAM) assuming the overdispersion values of 10% (OD = 10) and.20% (OD = 20). OD is calculated as part of central age model.
Fine-grained quartz yields younger age estimates than coarse quartz grains (Fig. 5). We constructed Bayesian age-depth models of MEK-2 and MEK-2B using OSL ages of fine-grained quartz (Fig. 5). Ages of fine-grained quartz at 1.90–2.05 m and 3.85–4.00 m depths (gsj18026 and gsj18028) show age-reversals and thus were excluded as outliers from the age-depth model. While the ages of the 62–90 μm quartz fractions at 8.2 m depth (gsj18032) overlap with the 95% confidence interval of the model, the age at 6.6 m depth (gsj18034) are apparently older than expected from the model. The single-grain minimum age from 6.6 m is also consistent with the model, but the age at 8.2 m seems to be slightly overestimated.
IR50 ages of fine-grained samples are generally younger than those of sand samples (Fig. 5). The differences between OSL and fading-corrected IR50 ages are generally 300–500 years, but those of fine-grained samples from site MEK-2B are relatively small (ca. 150–200 years). The pIRIR150 signal from polymineral fine grains was weak and De values were not obtained due to the poor recycling ratios (Fig. 2C). The pIRIR150 ages obtained from feldspar were older than 3 ka (Table 3), and, notably, the pIRIR150 ages of coarser fractions of sand are younger than those of finer fractions of sand.
Residual doses of modern flood deposits
Fine-grained quartz from modern flood deposits on levees yielded small De values (<0.1 Gy) and are considered to be almost fully bleached except sample gsi18330, which had a residual dose of 2.43 ± 0.04 Gy. Samples gsj18323 and gsj18329, which were obtained on bars, have quartz residual doses of 0.07 ± 0.00 and 1.55 ± 0.05 Gy, respectively. The residual doses of quartz sand are 0.3–0.7 Gy and higher than those from well-bleached, fine-grained quartz. The coarser fractions of quartz sand have smaller residual doses than the finer fractions for samples gsj18322 and gsj18324, but the residual dose of 211–250 μm fractions from gsj18327 are almost equivalent to that of 62–90 μm fractions from gsj18328. The IR50 signals of fine-grained samples are also better bleached compared to those of sand samples. The pIRIR150 residual doses of 211–250 μm fractions are 15–30 Gy, while finer fractions show higher residual doses of ca. 40 Gy.
. DISCUSSION
Bleaching of fluvial deposits
We found that five out of seven modern fine-grained quartz samples are almost completely bleached (Table 5), which indicates that the fine-grained fluvial sediments in the Mekong River floodplain generally yield reliable quartz OSL ages. However, two samples (gsi18329 and gsj18330) have residual doses of 1.6–2.4 Gy, corresponding to ca. 500–800 a. Hu et al. (2010) found that fine-grained fractions from fluvial sand deposits in the Yellow River system have large residual doses possibly because of large mud aggregates whose interior is not bleached. The sample gsj18329 consists of silty sand and may contain such aggregates. In contrast, sample gsj18330 had large residual doses despite being mainly composed of silt. Fine-grained suspended sediments may have residual doses of a few Gy during the transport in the river channel (e.g. Yellow River; Hu et al. 2010), and the shade of trees at the site MEK-1B may have prevented exposure of sediments to sunlight prior to deposition. However, several other possibilities may also cause large residual doses, perhaps including reworking of old sediments from nearby sites. Our results suggest that most of fine-grained quartz grains are sufficiently bleached during slow settling in shallow water prior to deposition.
Table 5
Residual doses of modern flood deposits. The “Q”, “F”, and “P” denotes quartz, K-feldspar, and polymineral fine grains, respectively. “OD” is overdispersion value of quartz sample calculated using central age model.
At sites MEK-2 and MEK-2B, fine-grained quartz ages are younger than sand quartz ages (Fig. 5). This is consistent with the results of modern flood deposits that show residual doses of 0.3–0.7 Gy from quartz sand grains compared to almost full bleaching of fine-grained quartz grains (Table 5). Furthermore, the single-grain minimum ages from 6.6 m and 8.2 m are almost consistent with the age-depth model or slightly overestimated. These suggest that the fine-grained quartz grains are bleached at deposition even better than relatively well-bleached sand grains. Causes of the two age reversals of fine-grained quartz OSL (gsj18026 and gsj18028) are not clear, but possibly related to the aggregates (e.g. Hu et al. 2010).
The finer fractions of quartz sand have larger residual doses than the coarser fractions for two modern samples (gsj18322 and gsj18324), and the residual dose of 62–90 μm fractions from gsj18328 are almost equivalent to that of 211–250 μm fractions from gsj18327 (Table 5). In contrast, 62–90 μm fractions of quartz are 300–400 yr younger than 211–250 μm fractions at site MEK-2B (Fig. 5), which suggests that finer fractions of sand were preferentially bleached on the point bar. The preferential bleaching of finer sand fraction may be due to local reworking of sediments on point bars, greater potential of reworking for finer fractions of sand, and slower settling velocities.
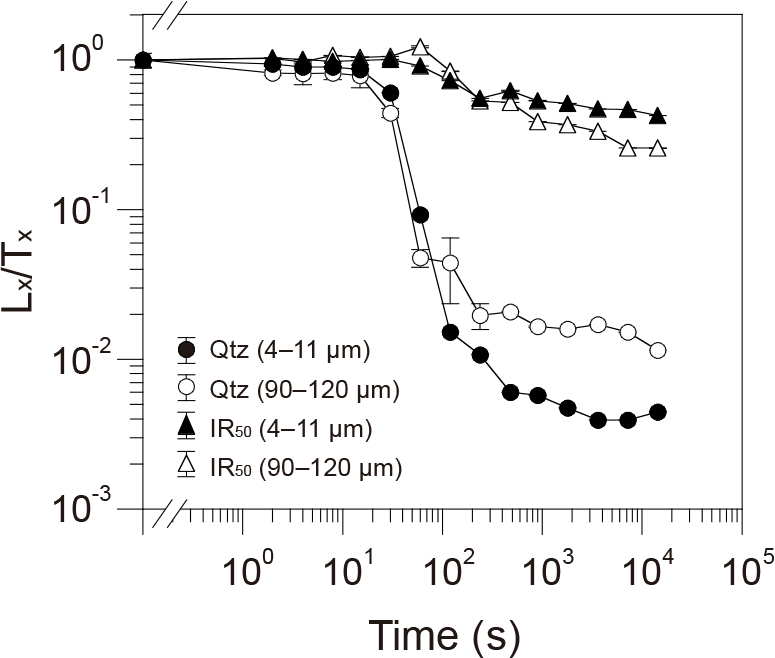
The bleaching test using artificial sunlight shows that the quartz OSL signal decreases more rapidly than the IR50 signal (Fig. 8). Therefore, the coincidence of OSL and IR50 ages can be used to ensure the complete bleaching of the quartz OSL signal (Murray et al., 2012; Sugisaki et al., 2015). All the fading-corrected IR50 ages obtained in this study are older than quartz OSL ages (Fig. 5; Table 3) and it is difficult to ensure the complete bleaching of quartz OSL signal using IR50 signal of feldspars or polymineral fine grains. However, the differences between OSL and IR50 ages of two fine-grained samples (gsj18031 and gsj18033) are smaller than those of coarse grains (Fig. 5). The modern flood deposits of fine-grained samples also have small IR50 residual doses compared to those of sand samples. These differences may indicate that the fine-grained quartz grains are generally better bleached than the quartz sand grains.
Fig. 8
Bleaching rates for OSL and IR50 of fine-grained and sand-sized samples (gsj18033 and gsj18034). The error bars represent one standard error.
The residual doses of incompletely bleached fine-grained quartz grains from modern flood deposits (2.43 ± 0.04 Gy; gsj18330) are comparable to those from suspended sediments collected in the middle reach of the Yellow River (0.6–1.6 Gy; Hu et al., 2010). In contrast, fine-grained quartz grains from suspended particulate matter obtained in the lower reaches of the Yellow River have smaller residual doses (0.18 Gy; Sugisaki et al. 2015), which suggests that they are bleached during transport. In the Ganges–Brahmaputra–Meghna Delta, fine-grained quartz grains are sufficiently bleached prior to deposition, and reliable quartz OSL ages can be obtained for sediments deposited within the last few hundred years (Chamberlain et al. 2017). Modern suspended load of the Mississippi River also has small residual doses of 0.02–0.14 Gy (Munoz et al., 2018). In the middle and lower reaches of large river systems, fine-grained quartz grains may have small residual doses (less than a few Gy) during transport because of the long transport distances and may be almost fully bleached during slow settling prior to deposition.
Natural levee development
Based on radiocarbon dates of bulk sediments or plant fragments, the point bar at site MEK-2B is estimated to have formed between 1700 and 2500 cal yr BP (Oketani and Haruyama, 2011), but this estimate is significantly older than the quartz OSL ages. The details of dated materials were not described in detail by Oketani and Haruyama (2011), and the older radiocarbon dates may reflect contamination with older organic carbon (Grimm et al., 2009) or reworked material.
The time scales for establishing natural levees on point bars are essential for understanding floodplain evolution but have rarely been investigated. The quartz OSL age obtained from the lowest part of natural levee deposits (400 ± 20 a) is relatively close to those obtained from mud beds in the point-bar deposits (480 ± 30 and 550 ± 30 a). Furthermore, the natural levee deposits seem to be deposited within a few centuries (Fig. 5). These ages suggest that rapid overbank deposition occurred shortly after the end of point-bar deposition and the natural levee was established within a few centuries.
The age-depth modelling shows that the median sedimentation rates of natural levee deposits at sites MEK-2 are 42-50 mm/yr. This rate is comparable to Mississippi Delta (10–40 mm/yr; Shen et al., 2015) and Nobi Plain in Japan (13.5 mm/yr; Hori et al., 2011) but significantly higher than those reported in the upper Columbia River floodplain in Canada (1.65 mm/yr; Makaske et al., 2009). In the Mekong River floodplain, large-scale crevasse splays and residual channels due to avulsions are relatively scarce despite natural levees appearing to be highly aggradational. Further application of OSL dating to fine-grained quartz in fluvial sediments in the Mekong River will constrain the Holocene chronology of natural levee and floodplain evolution.
. CONCLUSION
This study investigated the degree of bleaching of fluvial deposits in the Mekong River floodplain by comparing the ages obtained from quartz OSL, feldspar and polymineral IR50, and pIRIR150 signals. The fading-corrected IR50 ages were older than the quartz OSL ages for all samples, and it is difficult to ensure sufficient bleaching of the quartz OSL signal. However, we infer that fine-grained quartz grains are generally well bleached based on the low residual doses of modern flood deposits. A comparison of fine-grained quartz OSL ages with single-grain ages obtained from the point-bar deposits also suggests that the fine-grained deposits are well bleached. Therefore, a plausible age-depth model can be made using fine-grained quartz OSL ages. Fine-grained quartz may be sufficiently bleached in other large rivers because of the long transport distances.