
. INTRODUCTION
The E1’ centre, an unpaired electron at an oxygen vacancy (Feigl et al., 1974), is one of the most common and fundamental paramagnetic defects in quartz, for which the atomic configuration was proposed by Rudra and Fowler (1987). The signal was used in electron spin resonance (ESR) dating of geological faults (e.g. Ikeya et al., 1982), assuming that the signal is erased by grinding of quartz grains by faulting while the signal is created by radiation, which is usually the case of ordinary ESR signals to be used for dating. However, the formation of the signal of the E1’ centre is not that simple.
It was already known that the intensity of the E1’ centre increased on heating when the signal was first found (Weeks and Nelson, 1960). In one of the later works, Jani et al. (1983) proposed that it is due to an electronic process in quartz that electronic holes are transferred on heating from the Al centre, an electronic hole trapped at the Al atom replacing Si (O’Brien, 1955), to neutral oxygen vacancies with two electrons (Si-Si bond), so that they recombine one of the two electrons to form the E1’ centre. Based on this electronic process, Toyoda and Ikeya (1991) proposed a protocol to estimate the total number of the oxygen vacancies, which is to measure the ESR intensity of the E1’ centre after gamma ray irradiation to more than 200 Gy (to form the Al centre of enough amount) followed by heating at 300°C for 15 minutes (to transfer the holes from the Al centre to the oxygen vacancies to have the heat-treated E1’ centre). The previous experimental results on the formation of the E1’ centre (Toyoda and Ikeya, 1991; Toyoda et al., 1996; Toyoda and Hattori, 2000; Usami et al., 2009) indicate that the observed signal intensity of the E1’ centre in quartz depends on the number of the oxygen vacancies (the precursor of the E1’ centre), the number of the Al centre, and the number of the holes transferred from the Al centre to the oxygen vacancies which is a function of the degree of heating.
These previous studies focusing on the formation of the oxygen vacancies and on the transferring electronic process, however, did not really answer the question of how a natural quartz sample has a specific signal intensity of the E1’ centre. In the natural environment, the sample receives the natural radiation, but at the same time, the trapped electron and holes created by the natural radiation would be transferred, in the geological time scale, by thermal activation processes. The previous works have investigated the latter thermal activation process with heating experiments in the laboratory time scale; however, the effect of radiation on the E1’ centre was not systematically investigated.
One caution is needed on the “counterfeit” E1’ centre formed by gamma ray irradiation. Toyoda and Schwarcz (1997a) found that a signal very similar to the E1’ centre is formed by gamma ray irradiation. The signal has the g factor (g=2.001) same as the E1’ centre and similar microwave power dependence; therefore is easily misidentified as the E1’ centre. The signal can be distinguished by its isotropic signal shape (one peak signal) (the “real” E1’ centre signal has two peaks due to almost axial symmetry) and lower thermal stability (erased by heating at 170°C for 15 minutes). As this counterfeit signal is formed by gamma ray irradiation, one can observe the increase of the “E1’ centre” by gamma ray irradiation to be erroneously used for ESR dating. In the present paper, the dose response of the E1’ centre is examined after removing the contribution of the counterfeit signal.
. EXPERIMENTAL PROCEDURES
Quartz grains of 0.25 to 1 mm were extracted from Mannari Granite, Okayama, Japan. After crushing the grains to 0.25 to 0.5 mm, they were separated into six portions. Five of them were heated at 250, 300, 400, 520, and 600°C (preheating), leaving one without heating. Aliquots of about 100 mg each were prepared of each portion to be irradiated by the gamma rays up to 9.5 kGy with a dose rate of 100 Gy/h by a 60Co source at Takasaki Advanced Radiation Research Institute of National Institutes for Quantum and Radiological Science and Technology. Stepwise heating experiments were done with the four aliquots (natural, preheating at 400°C without irradiation, preheating at 400°C and subsequent irradiation to 430 Gy, and preheating at 520°C and 430 Gy) up to 480°C with a heating duration of 15 minutes using a muffle furnace. The dose responses of the E1’ centre were examined with the aliquots without heating and subsequent post-heating at 170°C and at 300°C for 15 minutes. Without post-heating, the signal intensity includes the contribution from the counterfeit E1’ centre signal, while heating at 170°C removes that contribution and heating at 300°C makes the intensity maximized due to the transfer of the holes.
ESR measurements were made at room temperature with an ESR spectrometer, PX-2300, JEOL, at the Okayama University of Science with the following conditions, a microwave power of 0.01 mW (Toyoda et al., 2005), a modulation frequency of 100 kHz and an amplitude of 0.1 mT, a scan range set to 5 mT but actual scan just around the signal, a time constant of 0.03 s, and a scan time 30 s set for the full scan range. The signal intensity amplitude depended on the signal intensity where an appropriate repeating time was chosen to have a good S/N ratio of the signal. The peak to peak of the spectrum of the E1’ centre was taken as the signal intensity. After the intensity was normalized by the mass and calibrated with a tempol benzene solution of known concentration, the signal intensity was denoted as the N-unit defined as 1.3×10¹⁵ spin/g (Toyoda and Naruse, 2002).
The sensitivity variation of the spectrometer was checked with MgO:Mn2+ marker to find the day to day variation was typically within 1.7% in a week. It was assumed that the signal intensity of the E1’ centre has similar variability as aliquots of the almost same amount (about 100 mg) of quartz samples extracted from a granite were measured in the present study.
. RESULTS AND DISCUSSIONS
The shape of the spectrum
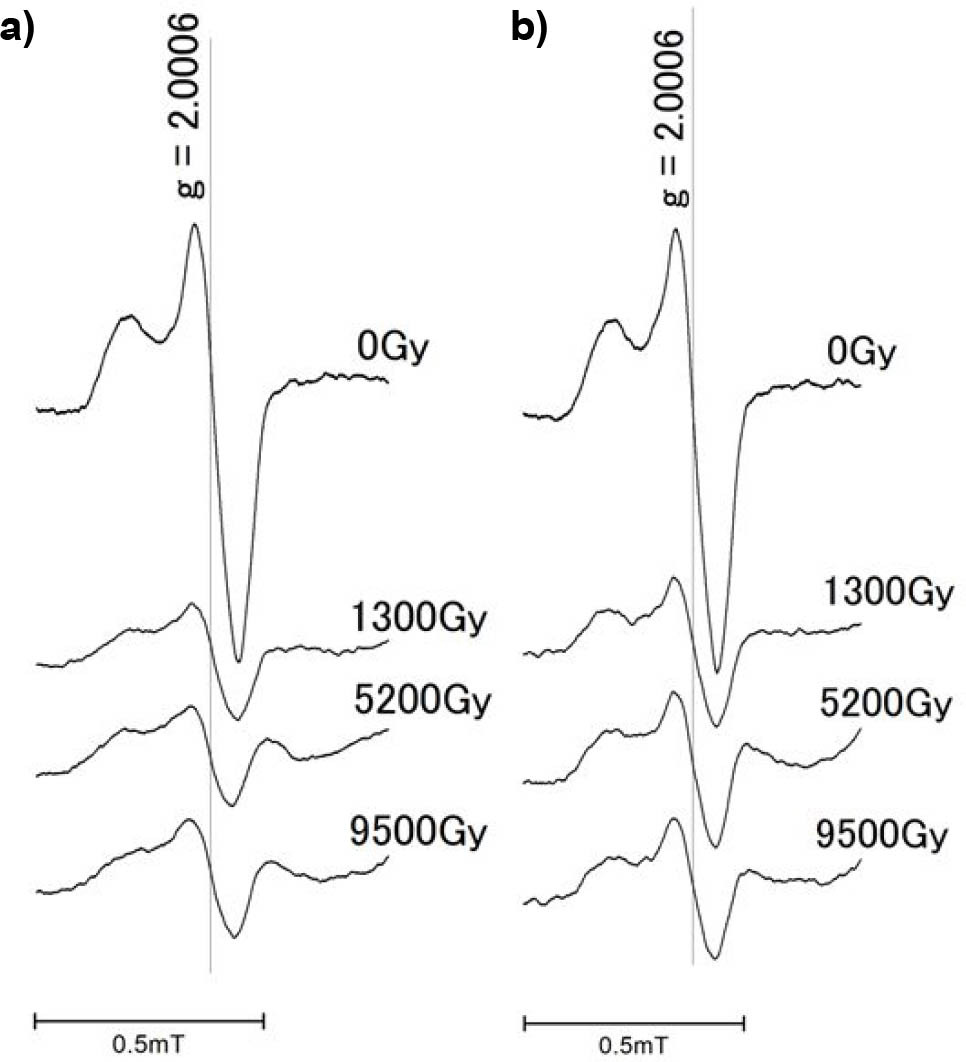
The spectrum of the E1’ centre changed with irradiation, as shown in Fig. 1a. The anisotropic principal g factors were reported as 2.00179, 2.00053, and 2.00030 (Jani et al., 1983). As the latter two g factors are so close, the spectrum shows that of the axial symmetry when the modulation amplitude is 0.1 mT, having two peaks as shown at the top in Fig. 1a before irradiation. The peak at the lower magnetic field became ambiguous with irradiation, so that it almost vanished with 9.5 kGy in Fig. 1a. The change of the shape of the spectra is consistent with previous work by Toyoda and Schwarcz (1997a); however, the overall signal intensity decreased with irradiation, which was different. After post heating at 170°C, all peaks at the lower magnetic field are clearer in Fig. 1b, indicating that the contribution from the counterfeit signal was removed, but the contribution in the present particular sample would probably be much smaller than the previous work (Toyoda and Schwarcz, 1997a).
Fig. 1
(a) ESR spectra observed in irradiated quartz samples. The peak at lower field gets smaller with dose relative to the one at higher field, indicating the contribution from the counterfeit E1’ centre signal. (b) ESR spectra after post-heating at 170°C of the same samples in (a). The signal shapes of all spectra return to those of the “real” E1’ centre with clear two peaks.
Stepwise heating
The results of stepwise heating experiments are shown in Fig. 2. The natural aliquot shows the increase of the signal intensity of the E1’ centre on the heating before decreasing above 300°C as already reported (e.g. Toyoda and Ikeya, 1991). The E1’ centre signal intensity of the aliquot preheated at 400°C without irradiation did not change up to 380°C. However, with irradiation, the intensity increased on heating and at 300°C to the same level as natural aliquot. This is because the electronic holes created by radiation are transferred to oxygen vacancies again to create the E1’ centre where the number of the precursor oxygen vacancies is the same as natural aliquot. When preheating temperature was 520°C with irradiation, the shape of the increase and decrease on stepwise heating is the same as the one with preheating at 400°C, but the signal intensity was smaller. This can be explained by the decay of the oxygen vacancies on preheating. The number of precursors decreased on preheating at 520°C as the decay was previously reported by Toyoda and Ikeya (1991); therefore, the maximum intensity around 300°C on stepwise heating is smaller.
Fig. 2
Results of the stepwise heating experiments with duration of 15 minutes at each step. The samples were pre-heated and subsequently irradiated as indicated prior to the stepwise heating.
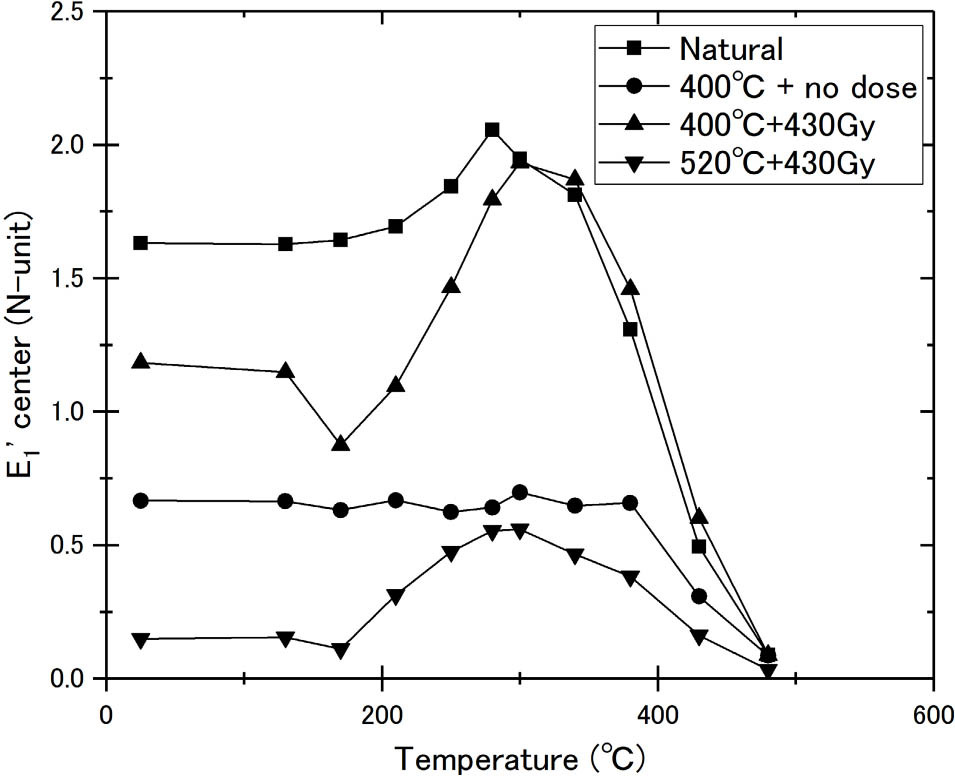
It would be noted in Fig. 2 that irradiated aliquots show a small dip of the signal intensity at 170°C. This is due to the decay of the counterfeit E1’ centre, where the signal shape of these aliquots indicates that contribution, but above the temperature, the signal shape was the usual E1’ centre with two peaks.
The dose response of the E1’ centre
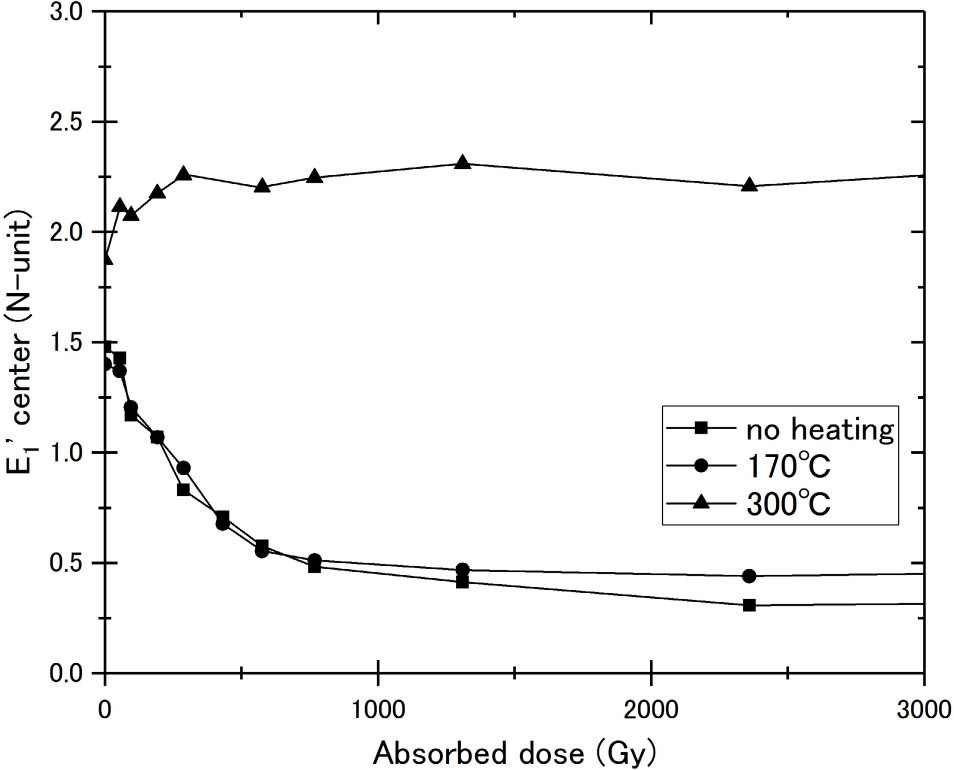
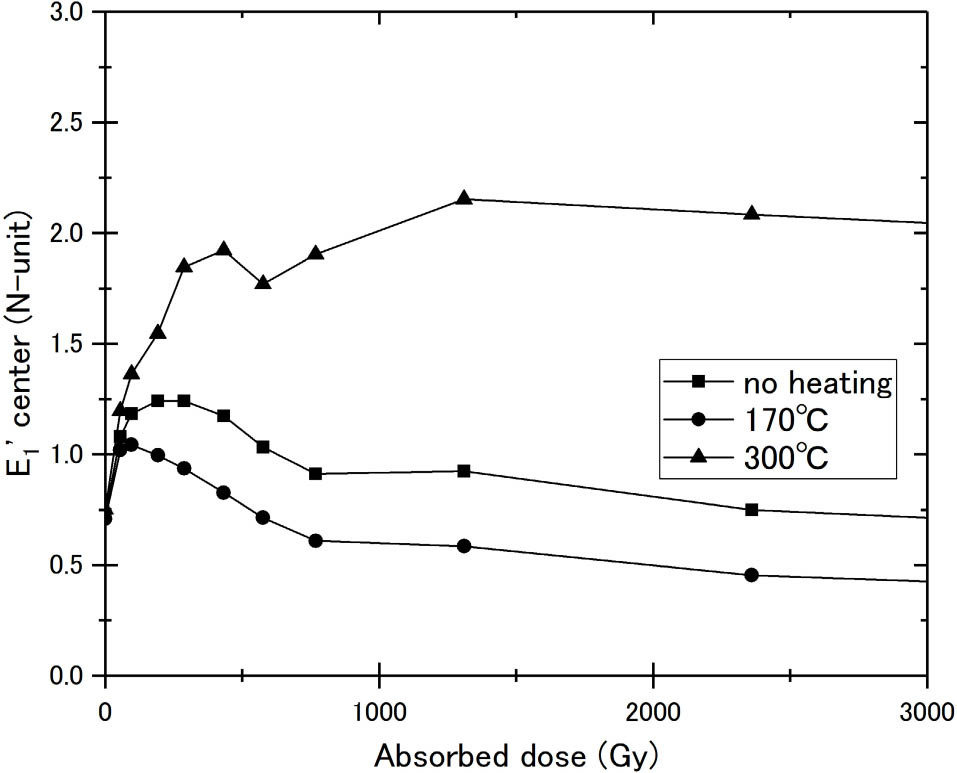
The dose response of the E1’ centre signal intensity of aliquots without preheating is shown in Fig. 3. The signal intensities of the E1’ centre decreased with the dose. The intensities did not change on post-heating at 170°C, indicating no contribution from the counterfeit signal in this dose range. After heating at 300°C, the E1’ centre signal intensity slightly increased with dose and stayed at the same level at a higher dose range. This would be due to a slight increase in the number of transferring holes in the lower dose range and to the limitation of the number of oxygen vacancies, which does not change with irradiation in this dose range.
Fig. 3
The dose responses of the signal intensities of the E1’ centre observed in samples with no preheating. The natural quartz sample aliquots were irradiated to the indicated doses and the signal intensities were measured (no heating). The samples were then post-heated at 170°C and the signal intensities were measured (170°C). Then, the samples were again subsequently heated at 300°C before the third ESR measurements (300°C).
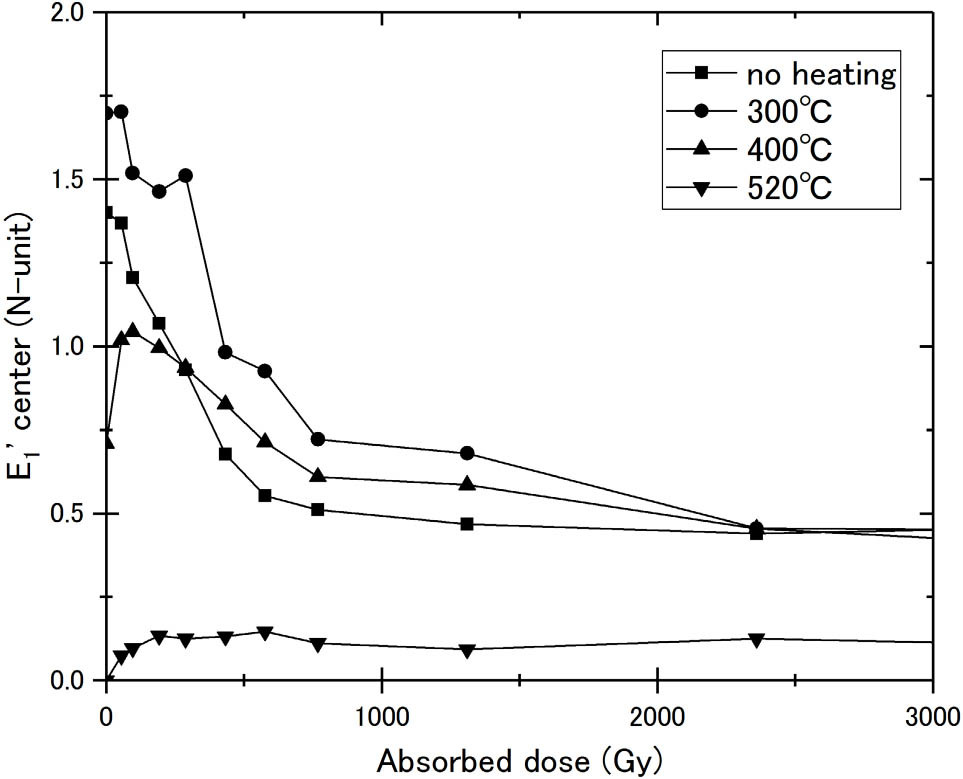
The dose responses of the E1’ centre after post-heating at 170°C are shown in Fig. 4, where the temperatures indicated in the figure are those of preheating. As heating at 170°C removes the contribution of the counterfeit signal, these are the dose responses of the “real” E1’ centre. It is interesting that the signal intensities in aliquots without irradiation and with preheating at 300°C decrease monotonically with dose while those heated at 400°C once increase up to 100 Gy and then decrease. The one heated at 520°C shows also increase, then saturated, but the level is much lower than those post-heated at 300°C (Fig. 2). The dose response of the signal in the aliquots preheated at 250°C was between natural (without heating) and 300°C.
Fig. 4
The dose responses of the signal intensities of the E1’ centre observed in samples with post-heating at 170°C. The sample portions were pre-heated at indicated temperatures, then, 12 aliquots were prepared from each portion and irradiated to the doses as indicated. The aliquots were post-heated at 170°C in order to remove the interference of the counterfeit signal, and the signal intensities were measured.
Contribution of the counterfeit signal
The counterfeit signal was not formed in natural aliquots as shown in Fig. 2, however, the contribution was clearly seen in the aliquots preheated at 400°C as shown in Fig. 5. The signal intensity systematically decreased by post-heating at 170°C due to the decay of the counterfeit signal. The gamma ray irradiation did not create the counterfeit signal in the natural aliquots of the present particular sample but did in preheated aliquots.
Fig. 5
The dose responses of the signal intensities in samples with pre-heating at 400°C without post-heating and with post-heating at indicated temperatures. The sample aliquots were irradiated to the doses as indicated and ESR signal intensities were measured (no heating). The aliquots were post-heated at 170°C and ESR signal intensities were measured. Then, subsequently heated at 300°C before the third ESR measurements.
Toyoda and Schwarcz (1997a) showed that the counterfeit E1’ centre signal was created by gamma ray irradiation in granitic quartz and their subsequent paper (Toyoda and Schwarcz, 1997b) indicated that the counterfeit E1’ centre signal was observed in quartz extracted from a fault gouge after gamma ray irradiation. The present result would indicate that this counterfeit E1’ centre signal is not always created by gamma ray irradiation in quartz but depends on the pre-treatment of the samples. In Fig. 2, a dip at 170°C in the stepwise heating experiment corresponds to the decay of the counterfeit E1’ centre signal for the sample preheated at 400°C. A similar dip was also observed for that preheated at 520°C, with a smaller amount. As already described in Toyoda and Schwarcz (1997a), the counterfeit E1’ centre signal may be related to the number of the oxygen vacancies, which would support the suggestion by Mashkovtsev and Pan (2018) that this signal corresponds to the newly found E9’ or E13’ centre in quartz. The condition for the formation of the counterfeit E1’ centre signal is an issue further to be investigated.
Electronic processes during irradiation and heating
Both, irradiation with ionizing radiation and heating, induce electronic processes in the minerals. Ionizing radiation creates pairs of electrons and holes, a part of which are trapped by lattice defects or by impurities. Those trapped electrons and holes are measured by ESR or by luminescence to deduce the accumulated radiation doses and hence the ages. Heating induces the activation of those trapped electrons and holes to recombine through thermal activation processes. In the geological time scale, they limit the dating range while they are experimentally used to erase the unstable electrons and holes. As for the formation of the E1’ centre in quartz, Jani et al. (1983) proposed that holes trapped at the Al hole centre are transferred on heating to diamagnetic neutral oxygen vacancies with two electrons (Si-Si) bond to recombine one of the electrons to form the centre. In the present study, it was found that irradiation reduces the signal intensity of the E1’ centre when the sample has been preheated at 300°C or at a lower temperature, while the intensity once increased and then decrease when the pre-heating has been 300°C or higher. These phenomena could be explained if irradiation supplies electrons while heating supplies electronic holes to oxygen vacancies, where the latter was already proposed by Jani et al. (1983).
On heating at 300°C or at a lower temperature, holes are supplied to diamagnetic oxygen vacancies with two electrons to recombine one of the electrons to form the E1’ centre. If holes are still supplied to the E1’ centre at a higher temperature, they will possibly also recombine with the electron at the E1’ centre to form oxygen vacancies without electrons, which are ESR insensitive. This process would explain the decrease in the E1’ centre on heating at a temperature higher than 300°C in Fig. 2.
By irradiation, electrons are supplied to the E1’ centre in the sample preheated at 300°C or at a lower temperature to make the E1’ centre the oxygen vacancy with two electrons, which are ESR insensitive, explaining the decrease in the dose responses in Fig. 4. When the sample has been preheated at 400°C or at a higher temperature, the samples would have only oxygen vacancies without any electrons according to the above discussion, and by supplying electrons by irradiation of smaller dose, the oxygen vacancies will trap one electron to become the E1’ centre, which explains the increases of the intensity up to 50 or 100 Gy in Fig. 4. With higher doses, electrons are further supplied so that the E1’ centre will trap another electron to become a neutral oxygen vacancy, ESR insensitive, which cause the decrease observed at the higher dose range.
The intensity of the E1’ centre in natural samples
Quartz is one of the most abundant minerals on the surface of the Earth. The grains stay in the stratigraphic layers or in the rock for a geological time scale. During the time, quartz grains receive natural radiation and at the same time, thermal activation processes occur in the minerals even at the environmental temperature. The effect of the thermal activation processes in the geological time scale would be equivalent to that in the laboratory time scale occurring at a higher temperature. As these two processes, natural radiation and thermal activation process, may induce the reactions to the opposite directions as shown in the present study. The natural signal intensity of the E1’ centre in quartz would be the result of the balance of these processes. It would imply that the natural environment might be possibly estimated by the natural signal intensity of the E1’ centre. Further studies would be necessary to examine quartz being at various temperatures in the natural environment, such as in drilled cores and that with various natural dose rates.
. SUMMARY
The dose response to gamma ray dose of the E1’ centre in quartz of granite was examined after removing the possible interference of the counterfeit E1’ centre signal by heating at 170°C for 15 minutes. It was found that the dose response depends on the pre-treatment of the sample. When the sample has been preheated at 300°C or at a lower temperature, the signal intensity decreases with dose while it once increases with dose up to 50 or 100 Gy then decrease above the dose when the sample was pre-heated at 400°C. These phenomena can be explained by the electronic processes that heating supplies electronic holes to the oxygen vacancies and that gamma ray irradiation supplies electrons. The natural intensity of the E1’ centre in quartz would probably be in the balance of these two processes.
The counterfeit E1’ centre signal was not created in the present particular sample without preheating but the one preheated. The condition for the formation of the counterfeit E1’ centre signal is an issue further to be investigated.