. Introduction
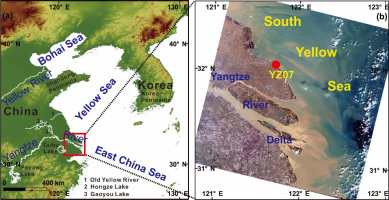
East China is close to an extensive coastal sedimentary environment. From north to south, three semienclosed continental shelf marginal seas (the Bohai, Yellow, and East China seas) surround the land boundary and form the north–south oriented coastline. With sea level rise and fall, transgression and regression have alternately shifted the coastal belts. The Yangtze (Changjiang) River is one of the world’s largest rivers, flowing eastward to the East China Sea and connecting the delta plain with the shelf–coastal sedimentary systems (Fig. 1a). The Yangtze River delta coast can thus be considered a natural laboratory for studying land–sea interactions and palaeoenvironmental changes. Since the 1980s, numerous research projects have been conducted to reconstruct the stratigraphic framework of the region with the intention of elucidating the relationship between delta evolution and sea level change (Li and Li, 1983; Stanley and Chen, 1993; Li et al., 2002; Yi et al., 2003; Zhu et al., 2003; Chen et al., 2004; Hori and Saito, 2007; Xu, 2008; Zhao et al., 2008; Wang et al., 2013; Xu et al., 2016). Previous studies have attempted to formulate a detailed chronological framework based on radiocarbon ages. However, it is difficult to achieve ideal results because radiocarbon dating of coastal sediments might be compromised by reworked deposition and old carbon reservoir effects, causing chronological inversions in the sediments (Gao, 2013; Gao and Collins, 2014). Additionally, biogenic carbonate might only be distributed sporadically (Hori et al., 2001). Therefore, a reliable chronology is needed to drive these studies forward.
Fig. 1
Map of the study area and its surrounding environment, (b) location of core YZ07. The DEM data in Fig. 1a were downloaded from http://srtm.csi.cgiar.org/. The base map in Fig. 1b was obtained from a Landsat TM 8 image http://glovis.usgs.gov/.
The optically stimulated luminescence (OSL) technique has been applied extensively to late Quaternary sediments since the single-aliquots regenerative (SAR) dose protocol was proposed by Murray and Wintle (2000). It has been proven a robust dating method for coastal and marine deposits all over the world (Jacobs, 2008; Sugisaki el al., 2010, 2012; Kim et al., 2014, 2015; Zhang et al., 2014), but its application has been limited in the Yangtze River delta. The results of some studies conducted in both the southern Taihu lake plain and subaqueous delta (Wang et al., 2013; Xu et al., 2013, 2016) and the Yangtze River estuary (Sugisaki et al., 2015; Wang et al., 2015) have been reported. However, few OSL dating studies have been performed on the coastline deposits of the southwestern margin of the South Yellow Sea (SYS).
In the current study, we tested the applicability of the OSL dating technique using coarse-grained (CG) quartz (90–200 µm) in a coastal sediment sequence retrieved from core YZ07, which was drilled on the southwestern coastline of the SYS on the northern flank of the Yangtze River delta (Fig. 1b). Based on 28 OSL samples, the chronological framework and an age–depth relationship for the upper 50 m of the core were established, from which the depositional history since the last glacial maximum (LGM) was reconstructed.
. Regional Setting, Sampling and Materials
The lower Yangtze River, which is greatly affected by the East Asian summer monsoon, is one of the world’s largest rivers in terms of its hydrological conditions (e.g., suspended sediment load, water discharge, length and drainage area) (Milliman et al., 1985). Because of the contribution of tidal energy in the present estuary, the river has formed a broad tidally dominated mud delta with funnel-shaped topography (Orton and Reading, 1993). According to Li et al. (2000), the apex of the Yangtze River delta is located at Zhenjiang–Yangzhou, and the delta area of approximately 52,000 km2 can be divided into a subaerial part (23,000 km2) and a subaqueous part (29,000 km2). The subaerial delta can be divided into three sections: the main delta body, which corresponds approximately to an incised valley formed during the last glacial period, and the southern and northern flanks of the delta plain. Moreover, each flank can be subdivided into two sections: a seaward section (coastal belts) and a landward section, based on the boundary of the maximum transgression after the LGM (Li et al., 2003). The elevation of the delta plain is mostly less than 5 m above the present sea level. The subaqueous part constitutes subtidal flats, the delta front and the prodelta (Xu et al, 2013).
The Yellow Sea is an epicontinental shallow sea between China and the Korean Peninsula. It is separated into the SYS and the North Yellow Sea by the Shandong Peninsula. The water depth of the SYS is generally less than 100 m (Liu et al, 2010). Its southwestern margin surrounds the northern Jiangsu coast and the north of Yangtze River delta. In 2013, a long core (YZ07, 32°5′2.40″N, 121°35′49.20″E, elevation -5 m, penetration depth 150 m), was drilled on the southwestern coast of the SYS (Fig. 1b). The core recovery was about 95.6%.
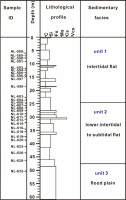
Overall, 28 OSL samples were collected from the upper 50 m of the core using a 5-cm-long, 3-cm diameter steel cylinder (Fig. 2). According to the lithology, three sedimentary units were recognized. Unit 1 consisted mainly of dark brown silty clay and a clayey silt fraction from ~24 m to the top. Meretrix (Linnaeus) was identified at a depth of ~5 m. The foraminiferal distribution of this section was sporadic with less than 3000 counts/50 g. The content of Epistominella naraensis was less than 5%, diatom fragments were less than 75%, and no intact diatoms were found. This unit is interpreted as an intertidal flat. Unit 2 comprised greyish coarse silt and fine sand from ~47 to ~24 m. The foraminiferal distribution ranged from 0 to 5000 counts/50 g and the content of E. naraensis was no more than 4%. The highest content of diatom fragments was about 80%, i.e., higher than the upper unit; thus, its depositional face is considered to belong to a lower intertidal to subtidal flat. Unit 3 (from 60 to 47 m) was dominated by fine sand deposits. At a depth of 53 m, there was a yellow–green fine sand layer containing gravel and clayey silt fractions with iron– manganese concretions and shell fragments. Additionally, two layers with Parafossarulus striatulus (Bensen), which lived in a freshwater environment, were distinguished and thus, the unit is interpreted as indicative of a flood plain environment.
. Methods
OSL sample preparation
All OSL sample preparation and luminescence measurements were performed at the Luminescence Dating Laboratory of NIGLAS (Nanjing, China). In the luminescence laboratory, the sediment at either end of the cylinders was scraped off for dose rate determination and the sediment unexposed to light in the middle part of the cylinder was used for equivalent dose (De) determination. The sediments were initially wet sieved to obtain the CG fraction and then treated with 30% H2O2 and 10% HCl to remove any organic matter and carbonates, respectively. Subsequently, the quartz-rich fraction (2.62–2.70 g/cm3) was extracted by density separation with sodium polytungstate. Finally, the quartz-rich fraction was etched with 40% hydrofluoric acid for one hour to remove the outer alpha-irradiated layer of the quartz grains and to eliminate feldspar contamination, and then the etchedfraction was rinsed with 10% HCI to remove any fluoride. The pure quartz grains were then mounted on 10-mm-diameter steel discs using silicone oil adhesive with a 2-mm-diameter monolayer for measurement.
OSL measurement and equipment
OSL measurements were performed on an automated luminescence reader (Risø TL/OSL DA-20) equipped with a 90Sr/90Y beta source. Quartz OSL signals were stimulated by blue LEDs (470 nm) and detected through a 7.5-mm Hoya U-340 filter. The SAR protocol was used for all OSL measurements (Murray and Wintle, 2000) and the purity of the isolated quartz for each aliquot was examined using the IR depletion (Duller, 2003) in the SAR sequence.
Dose rate determination
For dose rate measurement, the material was first dried to determine the water content and then about 10 g of the sample was ground to a homogeneous powder. The concentration of dose rate related elements: uranium (U), thorium (Th) and potassium (K) were measured by neutron activation analysis at the China Institute of Atomic Energy in Beijing. The cosmic ray contribution to dose rate for each sample was estimated as a function of depth, altitude and geomagnetic latitude (Prescott and Hutton, 1994). The water content was measured from the fresh sediments and an uncertainty of 10% was assumed for all samples. Greater consideration regarding the dose rate calculation is presented in Section 5 (Reliability of CG quartz OSL ages).
. Results
OSL pretests and luminescence characteristics
In order to select suitable preheat conditions for De determination, preheat plateau tests (PHT) (Fig. 3a) and dose recovery tests (DRT) (Fig. 3b) were conducted on a representative sample (NL-590). For both tests, the preheat temperatures ranged from 160 to 300°C at intervals of 20°C. At each preheat temperature point, preheat holds for 10 s with a cut-heat of 160°C and a heating rate of 5°C/s were applied and three aliquots were measured for calculating the mean value. For these preheat temperatures in the PHT and DRT tests, all recycling ratios ranged between 0.9 and 1.1, except at 300°C, and the recuperation values showed an increasing trend with elevated temperatures. Similarly, the measured Des in the PHT tests and the recovered ratio (measured/given) in the DRT tests displayed similar variation trends. However, in the lower preheat temperature ranges (e.g., 160 and 180°C) of both tests, the recuperation value was less than 5% and the variation trend of the measured De and recovered ratio was acceptable. This indicates the sensitivity of the OSL samples to preheat temperature. Thus, we chose a preheat temperature of 180°C for 10 s and a cut-heat of 160°C for De determination for all OSL samples.
Fig. 3
(a) Preheat plateau tests at a temperature range of 160–300°C at intervals of 20°C; (b) dose recovery tests at a temperature range of 160–300°C at intervals of 20°C; (c) histograms of recovered ratios conducted on 14 samples under fixed experimental conditions; (d) recovered tests measured under fixed experimental conditions from a series of irradiated doses on bleached aliquots.
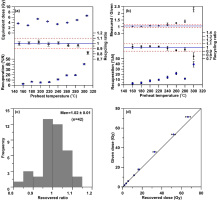
In order to ensure the suitability of the chosen preheat temperature, we chose 14 samples from the upper part of the sequence for dose recovery tests at the fixed preheat temperature of 180°C. The histograms illustrated in Fig. 3cshow summaries of the recovered ratios. For most aliquots, the recovered ratio ranged between 0.9 and 1.1, implying the chosen preheat temperature was appropriate. Additionally, the dose recovery test was designed at the fixed measurement conditions for a chosen representative sample (N-590). First, the sample was optically bleached and then given eight different beta-doses; for each dose, three aliquots were measured and the mean values calculated. The successfully recovered doses reached 70 Gy, far beyond the maximum dose of the oldest OSL sample in the current study (Fig. 3d). All the above tests demonstrated that the selected preheat temperature was suitable for the De measurements of all samples.
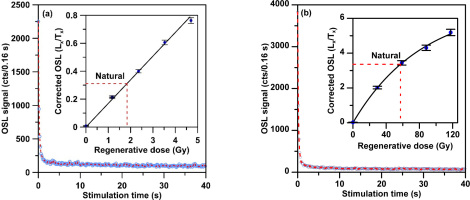
Fig. 4 presents the natural decay curves and growth curves (inset in Figs. 4a and b) of two representative samples: NL-589 (relatively young) and NL-632 (relatively old). The OSL signals of both samples decay very quickly during the first second of stimulation, suggesting the OSL signals are dominated by fast components. The growth curves were constructed using a single exponential function (inset in Figs. 4a and b) with six regenerative dose points, including one zero-dose for the measurement of recuperation and one repeated dose for the assessment of the sensitivity change during the measurement cycles.
Fig. 4
(a) Natural OSL decay curve and its growth curve (inset) fitted with single saturation exponential function for a representative young sample NL-589; (b) natural OSL decay curve and its growth curve (inset) fitted with single saturation exponential function for a representative old sample NL-632.
Des distribution and statistical analysis
One valid approach to identify the degree of OSL signal resetting for any sample is to check the equivalent dose distribution measured from single aliquots or single grains, especially for cases where incomplete bleaching is the primary cause of any excess dispersion and the larger contributor to the shape of the dose distribution (Murray et al., 2012). Based on this assumption, some statistical methods have been applied successfully to younger sediments that suffer from poor bleaching. The main advantage is that the De distribution can illustrate the scatter and dispersion of the De values. In this study, we examined the dose distribution and checked the potential partial bleaching for all OSL samples using statistical analysis. Considering our samples are relative young, we calculated the De values and overdispersion (OD) values using the unlogged central age model (CAM) of Arnold et al. (2009), which was revised from the original model of Galbraith et al. (1999). Fig. 5 shows the De distribution and relevant statistical characteristics for two representative samples (NL-588, NL-612). The results derived from the CAM model are marked in the radial plots of Figs. 5a and 5c, and the results from other statistical approaches are labelled in the kernel density estimation (KDE) plots of Figs. 5b and 5d. Both the radial and the KDE plots were drawn using the R package (Kreutzer et al., 2012; Dietze et al., 2013). When compared with the De values in Fig. 5, we found that the CAM De values were almost consistent with the mean values, median values and KDE maximum values. For the two representative samples, the OD values were 13% and 24%, respectively. Table 1 shows that the OD values of all samples vary between 14% and 50%. It could be argued that some OD values are relatively large (over 20%); however, we think them reasonable because the overdispersion of De was complex. The complex causes might arise from both intrinsic and extrinsic factors (Thomsen et al., 2005). In fact, as observed by Thomsen et al. (2012), even for laboratory overdispersion that excludes extrinsic factors, OD values of samples show a rising trend with increased dose. The shapes of the dose distributions are general symmetrical or slightly skewed and follow a normal Gaussian distribution, indicating that the samples were well bleached before burial. Further details of the statistical characteristics of all samples are presented in Table 1.
Fig. 5
De distributions and relevant statistical characteristics of two representative samples (a–d). Radial plot shows CAM De values (in red) and the De scatter for samples NL-588 (a) and NL-612 (c), respectively. Kernel density estimation (KDE) plot showing the shapes of De distributions for samples NL-588 (b) and NL-612 (d), respectively.
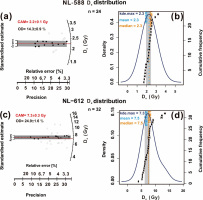
Table 1
Results of statistical characteristics of the 28 samples
Dose rate and OSL ages
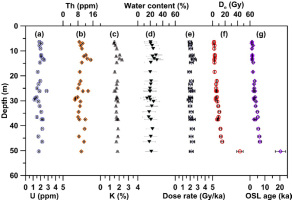
The concentrations of U, Th and K elements, water content, total dose rates and OSL ages for all 28 samples are summarized in Fig. 6 and Table 2. The average contents of U, Th, and K are ~2 ppm, ~12 ppm and ~2%, respectively (Fig. 6a–c). The total dose rates for all samples are centralised at 2 Gy/ka (Fig. 6e). This indicates a stable natural radioactive field for the sediments during burial. The Des values (Fig. 6f) and OSL ages (Fig. 6g) show similar variation trends; the OSL ages generally increase from ~1 to ~24 ka with depth.
Table 2
CG quartz OSL dating results of the 28 samples.
. Discussion
Reliability of CG quartz OSL ages
The reliability of the CG quartz OSL ages is illustrated in the following. First, we evaluate the intrinsic characteristics of luminescence. As described in Section 4 (OSL pretests and luminescence characteristics), the quartz grains had fast-dominated OSL signals. Furthermore, they produced ideal growth curves, satisfied the recycling ratio (0.9–1.1) and recuperation (<5%), as well as the expected recovery ratio, and they produced good dose recovery curves up to 70 Gy. These luminescence characteristics provide a robust warranty for CG quartz OSL dating. Furthermore, for each sample, the De values derived from different statistical models were generally consistent, indicating the samples might have been well bleached before deposition. Therefore, we concluded that optical dating could be considered reliable for establishing the chronology of the studied core.
Second, the dose rate is another major factor that could directly affect the accuracy of the OSL ages. Especially for water-laid sediments, dose rate estimation is always complex because of the uncertainties of the disequilibria in the uranium decay series, cosmic contribution and water content variation. These uncertainties might cause large deviations for realistic dose rates. When OSL samples are collected from marine, coastal beach or deep lake environments containing plenty of organic matter and precipitated carbonates, the likelihood of disequilibria in the uranium decay series should be considered (Olley et al., 1996; Long et al., 2015a, 2015b). Unfortunately, it is difficult to recognize disequilibria using the neutron activation analysis method, which only measures the concentrations of the parent isotopes in the decay chain. However, we infer that uranium disequilibrium might not be relevant in this study because there were very low contents of organic matter and carbonates in the sediments of core YZ07; the average loss on ignition was less than 3% (unpublished data). Furthermore, as shown in Table 2 and Fig. 6a, the average U content was ~2 ppm, indicating the contribution of the U decay chain nuclides to the total dose rate was less than 20%. Thus, irrespective of whether disequilibrium was present, it had little impact on the final dose rates and hence, on the chronological framework. Another point of complexity is the estimation of the cosmic contribution to the dose rate. Coastal sediments might undergo water column change due to accelerated sea level rise or experience variable thickness of the overburden because of rapid accumulation. Therefore, the attenuating effects on cosmic radiation are different for overlying sediments and the water column because of their differing densities. As shown in Fig. 7A (b, c), sea level was generally stable during the mid- to late Holocene (Lambeck and Chappell, 2001; Liu et al., 2004; Li et al., 2014). Hence, we compared the calculated cosmic dose rate of the samples from the top and bottom of the core. For the uppermost sample, the cosmic dose rate was 0.074 Gy/ka, and for all samples, the values were very small and less than 0.08 Gy/ka. (An uncertainty of 10% was estimated in the calculation of the cosmic dose rate.) Because the contribution of the cosmic dose rate to the total dose rate was also very small (<3.8%), the heterogeneous attenuating effects that might cause uncertainty in the cosmic dose rate were considered negligible. In addition, water content is another important factor that complicates dose rate estimates. However, it is difficult to determine water content as it could vary because of dewatering and compaction after deposition. In this study, we used the measured water content for the dose calculations. As shown in Fig. 6d and Table 2, the values varied by approximately 20% and they did not display any systematic trend with depth. Hence, we considered compaction had little effect on the water content of the sediments and we assumed an uncertainty of 10% would satisfy any realistic systematic error caused by the history of water change.
Fig. 7
A) Age–depth relationship of core YZ07 in (a). The process of sea level change since the LGM in (b–d). B) Comparison with adjacent Nakdong delta chronological sequence.
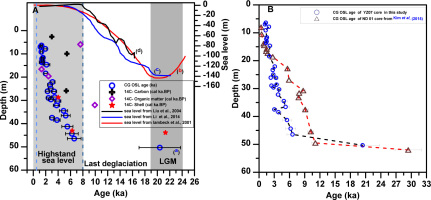
Third, the OSL chronology was compared with 10 independent 14C ages obtained using the accelerator mass spectrometry (AMS) dating technique (unpublished data). The 10 AMS 14C ages were dated using different materials from the sediments in the YZ07 core, i.e., charcoals (three samples), bulk organic matters (four samples) and shells (three samples). As shown in Fig. 7A, the AMS 14C ages from these three types of materials are significantly inversed with depth. Therefore, no single type of material could be used to build a reasonable chronostratigraphical sequence. Of course, we think this a very common case for coastal sedimentary systems because of the reworking of deposits or old carbon pollution (Gao, 2013; Gao and Collins, 2014). However, although the 10 AMS 14C ages show chronological inversion in the sediment sequence, four 14C ages (two from the organic matter and two from shells) are consistent with OSL ages in corresponding layer s. In contrast to the 14C chronological sequence, the OSL ages generally coincided with the stratigraphical order. Hence, this comparison of OSL ages with independent ages, at least to some degree, is powerful evidence illustrating the robustness of our OSL chronology.
Age–depth relationship and its implications
Based on all 28 OSL ages, the age–depth relationship of the uppermost 50 m of core YZ07 was established (Fig. 7A) and two distinct sediment accumulation periods were identified. From the LGM to the early Holocene (~24 to ~8 ka), a considerable hiatus in deposition occurred. In contrast, during the mid- to late Holocene (~8 to ~1 ka), sedimentation occurred at a very rapid rate (~6 m/ka) with accumulated thicknesses of up to 45 m.
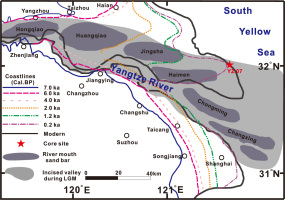
According to Hori et al. (2002), the fill-stacking pattern of the incised valley of the Yangtze River delta is a typical example of deposition controlled by the accelerated and decelerated sea level rise during the last deglaciation. As displayed in Fig. 7A (b–d), three reconstructed sea level curves from both global (Fig. 7b, in red) and regional (Fig. 7c and d, in blue and black, respectively) sedimentary records (Lambeck and Chappell, 2001; Liu et al., 2004; Li et al., 2014) indicate the characteristics of sea level change since the LGM. The sea level dropped to ~150 m below its present level during the LGM. During the period of lowstanding sea level, the base level of the stream of the palaeo-Yangtze River declined accordingly with intensified erosion, creating the deeply incised valley topography. The outline of the incised valley is delineated in Fig. 8 (grey elongated ribbon). Meanwhile, sediments were transported eastward and deposited on the outer shelf of the East China Sea, which resulted in the depositional hiatus in the study area during the LGM. At that time, the location of our core was in the incised valley ( Fig. 8), which might explain the depositional hiatus indicated in the YZ07 core. Following the melt-water pulse event of the last deglaciation (Fairbanks, 1989), sea level started to rise at the end of the LGM and accelerated in the post-glacial period. In conjunction with the last progressive transgression, the estuary and coastlines gradually retreated landward and the incised valley was filled (Li et al., 2002). After a period of accelerated rise, sea level change slowed at around 8–7 ka BP (Hori and Saito, 2007). At around 7.5 ka BP, the maximum transgression reached the Zhenjiang–Yangzhou area (blue line in Fig. 8). Subsequently, the main channel of the lower Yangtze River delta was initiated and it developed eastward from the apex of the delta to the modern estuary position with the emergence of six stages of step-like river mouth sand bars on the north bank of the Yangtze River. According to the depositional and developmental model proposed by the Delta Research Group (1978), there were six stages in the formation of the Yangtze River delta after the Holocene: the Hongqiao stage (7.5–6.0 ka BP), Huangqiao stage (6.5–4.0 ka BP), Jingsha stage (4.5–2.0 ka BP), Haimen stage (2.5–1.2 ka BP), Chongming stage (1.2–0.2 ka BP) and Changxing stage (0.7 ka BP to present), as shown in Fig. 8. During each of these stages, the river mouth sand bar and the contemporaneous palaeoshoreline, located in its frontal zone, constituted a subdelta. These palaeoshorelines are depicted by the coloured dotted or dashed lines (see legend in Fig. 8). The earliest exposed river mouth bar during the Hongqiao stage was dated at 6.0–5.5 cal ka BP by Song et al. (2013), which is nearly one millennium younger than the age estimated previously. In the initial stage of the formation of the Yangtze River delta, because the depositional rate was far beyond the rate of sea level rise, aggradation was dominant. Subsequently, with a series of exposed river mouth bars and the eastward movement, the depositional model gradually transformed from one dominated by aggradation into one dominated by progradation. Given the progradation and aggradation outlined in the above process, the history of high accumulation was thus recorded in our study area. Despite the same formation mechanism, the sedimentary rates of the subdeltas at all stages are approximate. However, according to the estimations of the Delta Research Group (1978), the accumulation rate varied in different parts of each subdelta. The highest value of the average sedimentary rate was at the river mouth sand bar (average depositional rate of ~1.36 cm/a), followed by the foreslope (~0.54 cm/a) and the prodelta (~0.31 cm/a). Because of the effect of the Coriolis force, the main channel of the Yangtze River gradually migrated to the southeast, while on the northern bank, the abandoned river channel and subdelta gradually merged and formed the modern Yangtze River delta. During the formation of the Yangtze River delta, the location of the YZ07 core was always on the foreslope of the subdelta or on the deltaic coast (Fig. 8), where the sedimentary environment was tidally dominated. During the entire process of the initiation and development of the Yangtze River delta, an average sediment accumulation rate of ~6 m/ka was recorded in the YZ07 core within the mid- to late Holocene (~8 to 1 ka). This is consistent with the accumulation rate (~0.54 cm/a) at the foreslope of the subdelta estimated by the Delta Research Group (1978).
Fig. 8
Migration history of coastline and the evolution of the Yangtze River delta since the LGM, modified from the Delta Research Group (1978) and Li and Li (1983).
We noted that the age–depth pattern and its sedimentary implications in the present study were very common when compared with other deltas in the marginal seas of the western Pacific Ocean, especially the coastal and deltaic sedimentary environments of adjacent areas. For example, in the eastern part of the Yellow sea, as reported by Kim et al. (2015), a chronological framework ranging from ~29.4 to ~0.4 ka was reconstructed, based on OSL dating of Nakdong deltaic sediments in the southeastern coastal area of the Korean Peninsula. Their chronological sequence revealed similar sedimentary features to those presented in this study (Fig. 7B). Another case was reported following a study in the Mekong River delta in southern Vietnam, which is located on the coast at the west of the South China Sea. Based on the geometry of the river deltas and OSL ages of beach ridges, Tamura et al. (2012) clarified the view of the three-dimensional sedimentary evolution and seaward progradation process of the Mekong River delta, as well as its shoreline changes during the mid- to late Holocene. Regardless of the unique controlling factors of both deltas, the formation and the accretion dynamics of the river mouth bar of the Mekong River delta (shown in Figs. 2and 3of their study), were found to be generally similar to the evolution of the Yangtze River delta and the migration history of the coastline, as shown in Fig. 8.
. Conclusions
This study tested the applicability of the quartz OSL dating technique to the coastal sediment sequence of core YZ07, retrieved from the southwestern coast of the SYS, on the northern flank of the Yangtze River delta. The OSL characteristics indicate that using CG quartz as a dosimeter is suitable for the SAR protocol. The reliability of the OSL ages was demonstrated by both intrinsic luminescence features and comparison with independent ages derived from 10 AMS 14C samples. Finally, a 24-ka sedimentary record for the uppermost 50 m of the YZ07 core was reconstructed.
This sedimentary sequence recorded the relationship of the Yangtze River delta evolution with its depositional accumulation history since the LGM. Because of the relatively low sea level before the Holocene, the decline of the base level of the palaeo-Yangtze River stream and strengthened erosion could have caused the formation of the incised valley in the study area, which might have contributed to a depositional hiatus from ~24 to 8 ka. Subsequently, with the sea level rise during the early Holocene, a significant transgression occurred in the study area at ~8 ka. The incised valley was first filled as the depocenter migrated landward. Thereafter, during the process of aggradation and progradation, the successive occurrence of estuarine sand bars and abandoned channels, constituting a subdelta, gradually merged and formed the Yangtze River delta. Consequently, our study core revealed a history of rapid sediment accumulation of the Yangtze River delta since 8 ka. Based on the age– depth results, we calculated the accumulation thickness was up to ~45 m and the sedimentation rate was ~6 m/ka from the mid- to late Holocene (~8 to 1 ka).
