. Introduction
Mountain snow cover is an important water source for arid areas. However, large amounts of snow can lead to destructive avalanches, floods, traffic interruptions, or even the collapse of buildings (Marty and Blanchet, 2012). The Tianshan Mountains comprise the largest mountain range in arid Central Asia, which is called the “wet island” of Central Asia. The climate of the Tianshan Mountains is dominated by westerly winds and it plays an important role in global climate change research (Huang et al., 2013). It is vital to understand the past climatic changes in this area and to explore possible influence mechanisms regarding the sustainable use of the regional water resources.
The northern slopes of the Tianshan Mountains in Xinjiang represent a populated area that is undergoing rapid development of agricultural and economic. In northern Xinjiang, the winters are long and cold and >80% of the annual precipitation is delivered as snowfall (Li, 1991). Most of the Tianshan Mountains are covered with snow in winter, and the heavy snow, snowstorms, avalanches, and snowmelt floods in spring can bring great economic losses and even threaten human survival. As an indicator of climatic change, snow depth is an interesting variable because it is dependent not only on temperature but also on precipitation (Beniston, 1997). Studies on the long-term snow cover conditions are also justified by the impact that the snow cover has on local climate and hydrology (Falarz, 2004). Snow depth is arguably the most basic and fundamental descriptive feature of surface snow cover. It provides an intuitive measure of the magnitude of a solid-precipitation event and it has societal importance as a water resource, especially under changing climatic conditions (Doesken and Judson, 1997). Understanding the long-term trends of snow depth in the northern Tianshan Mountains is particularly important for the local government and people, because it can provide basic data for accurate resource assessments, estimates of future hydrometeorological disasters, and information for the Xinjiang government regarding disaster prevention. However, few studies have focused on the long-term changes of snow depth (Beniston, 1997; Leathers and Luff, 1997; Laternser and Schneebeli, 2003; Falarz, 2004; Marty and Blanchet, 2012). In most cases, snow records in China are only a few decades in length, which limit long-term climate change research, and therefore proxy data are required for the research of past climate change. Fortunately, there are a large number of Schrenk spruce (Picea schrenkiana Fisch. et Mey) forests at 1700–3200 m in the Tianshan Mountains. Previous studies have shown that the tree-ring growth of the Schrenk spruce, grown in arid and semiarid mountainous environments, is sensitive to climate and thus is suitable for the reconstruction of past climate change (Li et al., 2006; Zhang et al., 2009, 2013, 2015b, 2016; Chen et al., 2011).
Dendroclimatology is an important method for examining pre-instrumental climatic variations. Because of the precise dating control, annual resolution, and comparability with instrumental meteorological data, tree-ring data have become increasingly valuable in disclosing the long-term dynamics of climate in different regions of the world (Briffa et al., 2001; Esper et al., 2002, 2007; Palmer et al., 2006; Liu et al., 2009; Cook et al., 2010; Shao et al., 2010; Büntgen et al., 2011). However, few studies (e.g., Woodhouse, 2003; Timilsena and Piechota, 2008; Yadav and Bhutiyani, 2013) have reconstructed snow cover using tree-ring chronologies as predictors. In this study, we developed five tree-ring-width chronologies for the northern Tianshan Mountains, analyzed tree-ring response to snow cover and its possible physiological significance, and reconstructed the century annual maximum snow depth of the northern Tianshan Mountains. Finally, the characteristics of the change in annual maximum snow depth over the past hundred years are presented. The purpose of this study is to understand the past century changes of snow cover in northern Tianshan Mountains, it is help for prevent and reduce the meteorological disaster and early warning of natural disasters.
. Materials and Methods
Study area
The study area is located in the southwestern part of the Junggar Basin, and on northern slope of the Tianshan Mountains in Xinjiang Uygur Autonomous Region, northwest of China. The north and west of study area is close the Republic of Kazakhstan. It is a mountainous region that occupies a V-shaped basin between the Dzungarian Alatau to the northwest and the Borohoro Mountains to the southwest. It has a typical continental climate that is dominated by westerly winds. The area is rich in water resources with the Ebi and Sayram lakes, and the Bortala and Jing rivers located on the alluvial plain between the mountains. The water resources are derived from orographic rain and meltwater from the mountains. As part of the Central Asian climate zone, the ecological environment is fragile and it has special status in global climate change research.
Development of tree-ring chronologies
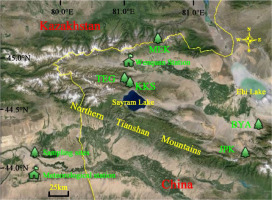
Trees were sampled according to the standards of the International Tree-Ring Data Bank. The five sites were located in the northern Tianshan Mountains (Fig. 1, Table 1). Samples of Schrenk spruce (Picea schrenkiana Fisch. et Mey) were collected from virgin forests in areas with the harshest conditions. Large replications of samples from the respective sites were used in this study to develop independent site chronologies. In all, 287 tree cores from 138 trees were collected from the five sites and used in preparation of the chronologies (Table 1).
Table 1.
Location information and basic chronology statisticsa.
MS — mean sensitivity; SD — standard deviation; AR1 — first-order autocorrelation.
a The details of site locations are shown in Fig 1.
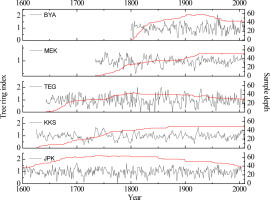
All samples (cores) were air-dried, fixed to slotted wooden bars, and then sanded with progressively finer sandpaper up to 600 grit (16 μm). Tree-ring widths were measured using a Velmex system (Velmex Inc., Bloomfield, NY, USA), which has an accuracy of 0.001 mm. The tree-ring samples were cross-dated visually and the quality control of the match checked using COFECHA software (Holmes, 1983). Each individual ring-width measurement series was detrended and standardized to ring-width indices using the ARSTAN program (Cook, 1985). Undesirable growth trends related to age and stand dynamics unrelated to climatic variations were removed from each series during the detrending process. We compared three detrending techniques to determine the best method: smoothing spline (fixed 67% cutoff), regional curve (Cook and Kairiukstis, 1990; Briffa and Melvin, 2011), and negative exponential curve fitting with and without application of an adaptive power transform (Cook and Petersk, 1997). Following these processes, we obtained three types of chronology: the standard chronology, residual chronology, and ARSTAN chronology. We compared the mean sensitivity, standard deviation, signal-to-noise ratio, and expressed population signal of all the chronologies, combined with the tree-ring-width response to climate, and chose smoothing spline (fixed 67% cutoff) as the most suitable detrending method. Finally, we obtained five standardized chronologies (Fig. 2). Subsample signal strength was used to assess the adequacy of the replication in the early years of the chronology, which can ensure the reliability of the reconstructed climate (Wigley et al., 1984). To use the maximum length of tree-ring chronologies and to ensure the reliability of the reconstructions, we restricted our analysis to the period with subsample signal strength of at least 0.85 (Table 1).
Meteorological data
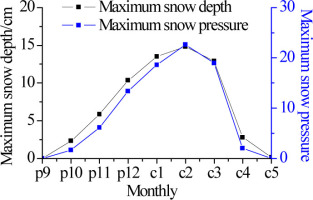
Meteorological data were obtained from the China Meteorological Data Sharing Service System (http://cdc.cma.gov.cn/). Considering its proximity to the sampling sites, higher elevation, and length of its climate records, we selected snow data from the Wenquan meteorological station (44°58′N, 91°01′E; elevation: 1354 m). The snow cover parameters included annual maximum snow depth, duration of snow cover ≥1 cm, and duration of snow cover ≥10 cm from 1958/1959–2009/10, and the maximum snow pressure from 1986/1987–2009/2010. The study area has typical semiarid temperate continental climate, characterized by arid weather, long durations of sunlight, and large diurnal temperature variations. The annual average temperature is around 3.7–7.4°C and the annual precipitation is 234 mm. The trends between maximum snow depth and maximum snow pressure are consistent with the highest values in February (Fig. 3).
Methods
The relationship between the tree-ring chronologies and snow cover data was analyzed using DENDROCLIM 2002 (Biondi and Waikul, 2004). All statistical procedures were evaluated at p<0.05 level of significance.
Annual maximum snow depth modeling was conducted using the transfer function approach (Fritts, 1976; Cook and Kairiukstis, 1990). Multiple stepwise linear regression was used to develop a linear model to estimate the dependent maximum snow depth variable from a set of potential tree-ring predictors.
The calibration model was evaluated based on the variance in the instrumental record explained by the model (R2cal). As the data set from 1958/59–2003/04 was too short for meaningful division into two subsets for calibration and verification purposes (Fritts et al., 1990), the leave-one-out cross-validation method (Michaelsen, 1987) was used to verify our reconstruction. This method calibrates a model based on an iterative process in which each of the predictor values is omitted from the calibration period in turn and then estimated. Verification tests included the reduction of error and sign test (Fritts, 1976).
In a final step, if the developed model passed the verification tests of the previous step, it was applied to the pre-instrumental tree-ring index series to estimate the long-term record of maximum snow depth.
. Results and Discussion
Tree growth–snow cover relationship
Table 1 shows the first-order autocorrelations of the five standardized chronologies are higher, and the highest is >0.7. It preliminarily indicates that in the northern Tianshan Mountains, radial growth of Schrenk spruce might reflect the effect of climatic factors prior to the growing season. Further analysis shows significant positive correlation between radial growth of Schrenk spruce and snow cover parameters; the best relationship is between maximum snow depth and tree-ring chronologies. The correlation coefficients between the BYA chronology and precipitation in winter is 0.392 (p<0.01, n = 52), between the MEK chronology and duration of snow cover ≥10 cm is 0.433 (p<0.01, n = 52), between the JPK chronology and duration of snow cover ≥1 cm is 0.349 (p<0.05, n = 46), between the TEG chronology and annual maximum snow pressure is 0.602 (p<0.01, n = 24), and between the MEK chronology and annual maximum snow depth is 0.404 (p<0.01, n = 52). Three correlation coefficients of three chronologies (MEK, TEG, and JPK) with annual maximum snow depth are over the 99% confidence level test, and the highest single correlation is 0.404 (Table 2). Thus, the maximum snow depth might be the principal limiting factor affecting the radial growth of Schrenk spruce trees within the study area.
Table 2.
Pearson Correlation between tree-ring chronologies and snow cover parameters.
| BYA | MEK | TEG | KKS | JPK | |
|---|---|---|---|---|---|
| Maximum snow depth (1958/59–2009/10) | 0.339* | 0.404** | 0.387** | 0.260 | 0.390** |
| Maximum snow pressure (1986/87–2009/10) | 0.298 | 0.443* | 0.602** | 0.298 | 0.242 |
| Duration of ≥1 cm depth (1958/59–2009/10) | 0.205 | 0.246 | 0.293* | 0.135 | 0.349* |
| Duration of ≥10 cm depth (1958/59–2009/10) | 0.295* | 0.433** | 0.308* | 0.246 | 0.314* |
| Precipitation in winter (1958/59–2009/10) | 0.392** | 0.345* | 0.075 | 0.375* | 0.276 |
Fritts (1976) suggested that climatic conditions in autumn, winter, and spring prior to the growing season might affect ring-width growth during the growing period. Snow plays an important role in a number of environmental and socioeconomic systems in mountain regions (Barry, 1992). Similarly, snow cover also has significant impact on the growth of trees in the mountains. The physiological significance of tree-ring response to snow cover is manifested in three ways. First, thicker snow cover can delay spring snowmelt, storing additional water for earlywood growth, which leads to a wider ring. Second, thicker snow cover can increase soil moisture content, compensating water loss caused by drought in spring. Water deficit in the early stages of the growing season suppresses rapid expansion of tracheids and cell division in the cambium of trees (Fritts, 1976; Akkemik, 2003). Many studies have shown that greater snowfall during the non-growth season means trees might absorb more moisture in the early part of the growing season (D’Arrigo and Jacoby, 1991; Diaz et al., 2002). Third, thicker snow cover plays an insulating role in keeping the temperature constant. A higher temperature might benefit the radial growth of spruce trees during the growing season because the growing season is advanced and there may be less winter damage to the shallow roots of the spruce trees (Liang et al., 2006; Zhang et al., 2015a). A study by Vaganov et al. (1999) showed that winter precipitation (snow cover) has a clearly positive trend with radial growth. Because winter precipitation shifts the onset of cambial activity to later dates, this leads to later activation of tree growth. Furthermore, the greater the amount of winter precipitation is, the greater its influence. Snow cover is a uniquely sensitive climate variable, which depends on temperature and precipitation at a variety of temporal and spatial scales (Marty and Blanchet, 2012). Tree-ring response to snow cover might indicate that comprehensive and complex signals of winter climate affect radial tree growth. Therefore, tree-rings can be considered as good indicators of snow cover variability in the northern Tianshan Mountains, which have physiological significance.
Maximum snow depth reconstruction and validation
The correlation and response analysis showed a high correlation coefficient between the five standardized tree-ring chronologies and maximum snow depth at the Wenquan station. Based on the results, the maximum snow depth was reconstructed and a transfer function designed as follows:
where SDmax is the maximum snow depth and TEG, JPK, MEK, BYA, and KKS are the five standard chronologies in the northern Tianshan Mountains. During the calibration period (1959–2004), the reconstruction tracks the observations well, with the explained variance of 48.3% (41.8% after adjustment for loss of degrees of freedom) of the observed maximum snow depth data. In model (3.1), n = 46, r = 0.695, F5, 40 = 7.5 and p <0.0001. In this study, the Durbin–Watson value (Durbin and Watson, 1951) was 2.394 for n = 46, which indicates no significant first-order autocorrelation in model (3.1). During the calibrated period (1958/59–2003/04), the reconstructed maximum snow depth data tracks the observations very well (Fig. 4). Thus, the reconstruction might be able to reveal the maximum snow depth variability over the past 194 years in the northern Tianshan Mountains.Fig. 4.
Reconstructed annual maximum snow depth in northern Tianshan Mountains (1809/10–2003/04 is shown in black. The 20-year low-pass filter of reconstructed is shown in blue. Observed maximum snow depth is shown in red line and the long-term reconstructed mean is shown by the dashed line.
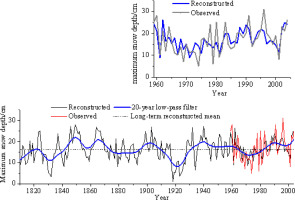
The model passed all the verification tests (Table 3). The cross-validation test yielded a positive reduction of error (0.316), thus indicating the predictive skill of the regression model. The statistically significant sign test (36+, 10−, p<0.01) and correlation (r = 0.577, p<0.01), and first difference sign test (31+, 14−, p<0.05) and correlation (r = 0.408, p<0.01), between the maximum snow depth data and the estimates derived from the leave-one-out method, are also indications of the validity of the reconstruction. Therefore, this equation can reconstruct the annual maximum snow depth from 1810–2004 in the northern Tianshan Mountains (Fig. 4). Fig. 4 also shows the annual maximum snow depth during the calibrated period from 1959–2004.
Characteristics of maximum snow depth over the past two centuries
The high-frequency variability of the maximum snow depth series over the past 195 yr in the northern Tianshan Mountains is within the range of 0.9–27.9 cm; for which the mean square deviation is 0.384. We obtained the low-frequency variability of the maximum snow depth series using the 20-yr low-pass filter method (Fig. 4). The low-frequency change is within the range of 8.2–21.9 cm; for which the mean square deviation is 0.210. The reconstructed series shows that maximum snow depth exhibits obvious stages change, the periods characterized by lower maximum snow depth were 1809/10–1840/41, 1873/74–1893/94, 1909/10–1929/30, 1964/65–1981/82, and the periods characterized by higher maximum snow depth were 1841/42–1872/73, 1894/95–1908/09, 1930/31–1963/64, and 1982/83–present. Because of the lack of studies on snow cover variability over the past 200 yr in the Tianshan Mountains, we compared the changes of the maximum snow depth with historical periods of precipitation and drought. A study by Zhang et al. (2015b) showed that the July–June precipitation of the western Tianshan Mountains in 1829–1842, 1881–1892, 1916–1928, and 1935–1982 was relatively less. These drought periods are remarkably consistent with the periods of lower maximum snow depth in our results. In addition, the four lower periods are consistent with the drought variability at the Asian summer monsoon fringe, particularly the two severe drought periods (Yang et al., 2014).
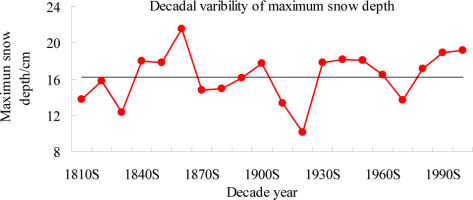
With regard to decadal changes, the decade with the highest maximum snow depth is the 1860s with an average value of 21.5 cm (+32.7%). The decade with lowest maximum snow depth is the 1920s with an average value of 10.2 cm (+37.4%) (Fig. 5), and this decade is consistent with the drought of the 1920s in northern China. The study by Liang et al. (2006) showed that a severe and sustained drought occurred in the 1920s and early 1930s, which was confirmed by tree rings and a variety of historical and instrumental records including hydrological, meteorological, and documentary evidence from the semiarid and arid areas of northern China. Fang et al. (2012) suggested the aridity that occurred in the 1920s–1930s was most severe in northern China. Li et al. (2006) showed that the late 1920s was the epoch with the most severe drought in the reconstruction of northern central China. From the 1970s to the present, the maximum snow depth has clearly increased with the change to a warmer and wetter climate in Xinjiang.
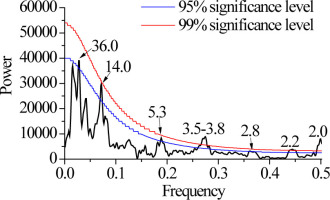
Strong interannual variability of the maximum snow depth was identified in the northern Tianshan Mountains by Thomson (1982) using the multi-taper method. There are significant changes of the annual maximum snow depth at 2.0-yr (99%), 2.2-yr (99%), 2.8-yr (95%), 3.5–3.8-yr (99%), 5.3-yr (95%), 14.0-yr (95%), and 36.0-yr (95%) cycles (Fig. 6). Most of these interannual cycles (5.3, 3.5–3.8, 2.8, 2.2, and 2.0 yr) in our reconstruction fall within the range of the El Niño Southern Oscillation (Allan et al., 1996). In addition, the 2–3-yr cycle that can also be identified in arid Central Asia (Huang et al., 2013), is linked to variations of the westerly circulation in the middle troposphere, which may indicate that our reconstructed maximum snow depth variability might have some teleconnections with oscillations of the land–atmosphere–ocean circulation systems. Furthermore, these high-frequency cycles can often be found in den-droclimatic studies of the Tianshan Mountains (e.g., Li et al., 2006; Zhang et al., 2009, 2013, 2015b, 2016) and other arid and semiarid sites in northwestern China (Liang et al., 2009; Chen et al., 2011; Liu et al., 2011). The decadal-scale cycles of 14.0 yr falls within the range of the Pacific Decadal Oscillation (Minobe, 1997; Mantua and Hare, 2002) and Atlantic Multidecadal Oscillation (Gray et al., 2004; Mann et al., 2009). The low-frequency peak (36-yr) is obviously consistent with periodic solar activity. In terms of climatic change, cycles with a length of 36 yr are not new. Brückner (1890) demonstrated that varied climatic phenomena in different regions of the world show phase synchronism with cycles of 33–37 yr and surmised connections with solar activity. This suggests that the maximum snow depth variability of the northern Tianshan Mountains might be related to large-scale oscillation of the climate system.
. Conclusions
We developed five tree-ring chronologies from 268 spruce trees sampled in the northern Tianshan Mountains. The tree growth–snow cover responses were analyzed in combination with snow cover data. It was found that maximum snow depth is the principal limiting factor that affects the radial growth of Schrenk spruce trees within the study area. Analysis showed that tree-ring response to snow has physiological significance. Hence, we reconstructed the century annual maximum snow depth for the northern Tianshan Mountains. This indicated that quasi-periodic changes exist on scales of 2.0–4.0, 5.3, 14.0, and 36.0 yr. The lower period of annual maximum snow depth during the 1920s–1930s is consistent with the severe drought that occurred in the 1920s and early 1930s in northern China. From the 1970s to the present, the maximum snow depth has clearly increased with the warmer and wetter climate in Xinjiang. We suggest future work could investigate links with the drought mechanisms of northern China when considering mechanisms of snow variability.
