
. INTRODUCTION
Optically stimulated luminescence (OSL) dating of sediments and thermoluminescence (TL) dating of heated ceramics, terracotta figurines and potteries has proven to be useful in investigating geo-archaeological sites. Especially single-grain quartz optically stimulated luminescence dating has shown to provide reliable ages for samples from a range of archaeological contexts (Guérin et al., 2012; Jacobs et al., 2012; Solongo et al., 2016; Solongo et al., 2014). Single grain luminescence dating is often preferred in order to distinguish grains which were well bleached at time of deposition from those incomplete bleached (Jacobs and Roberts, 2007), grains from all mixed-age deposits (Duller, 2008), and to identify post-depositional mixing of sedimentary units (Arnold and Roberts, 2009). The OSL characteristics of the individual grains have been analysed in view of the various factors, among which the statistical uncertainty due to photon counting and instrumental uncertainties to determine De (Duller, 2008; Thomsen, 2004); the grain-to-grain variability in OSL response to the measurement conditions in the luminescence signal intensity (Adamiec, 2005; Jacobs et al., 2006; Thomsen et al., 2002), but also the presence of fast, medium and slow components which can be identified using the OSL decay fitting procedures (Bailey et al., 2011) and LM-OSL measurements (Bulur et al., 2002). Separation of a ‘clean’ fast OSL component is thought to be required for reliable dating, as it is rapidly zeroed by sunlight and has sufficient thermal stability for dating the last few million years (Adamiec et al., 2010; Wintle and Murray, 2006). For multi-grain OSL, the low ratio of fast to medium components (Solongo et al., 2006) could cause the underestimation of equivalent dose (De) values. This under-estimation could be corrected, by eliminating grains with a low “fast ratio” (Durcan and Duller, 2011), which is the ratio between the initial signal (dominated by the fast component) and a later signal (dominated by the medium component). Especially for single-grain dating, the dominance of the fast component is assumed but rarely quantified. Recent studies (Duller, 2012; Feathers and Pagonis, 2015) focused on the need to investigate the luminescence characteristics of single grains further and improve the accuracy and precision of equivalent doses.
Our study examines single-grain chronologies for the archaeological site “the burials in Khutag Uul Mountains (Mongolia)”, associated with human activities from the Xiongnu period (3rd century BC – 2nd century AD) and from Turk period (552–745 AD) – using pottery and sedimentary samples from the same archaeological context. Based on the previous findings, e.g. the advantage of luminescence dating at the archaeological site using different dating materials (Solongo et al., 2019), the main aim of the present work includes the study of the luminescence characteristics of single grains from pottery quartz and sedimentary quartz. For single-grain dating, the dominance of the fast component using the fitting procedure will be quantified, and the effect of the ultra-fast component on the dose evaluation will be examined and analysed further by identifying the appropriate integration time integral using De-(t) plots.
. MATERIALS AND METHODS
Site and samples
The Orkhon Valley was the centre of numerous nomadic states; the Xiongnu (3rd century BC – 1st century AD), Turkic (552–745 AD), and Mongol Empires (12th – 14th centuries) succeeded one another in the steppes of Mongolia. Archaeological research in Orkhon Valley has concentrated on numerous steles with runic inscriptions, but also on numerous archaeological burials. Khutag Uul Mountains (47°36′N, 102°47′) is located on the left bank of the Khogshin Orkhon River on the eastern edge of the upper Orkhon valley; it was once a tribute to the people of ancient times. The Khutag Uul Cemetery is the largest in its territory. In 2009, during the fieldwork, a total of 121 burial sites were recorded in the south and additionally 43 burials on the east (Bayar et al., 2010), which immediately became the 2nd Khutag Uul Mountain Cemetery.
The settlement history at this site and the characteristic types of archaeological monuments, especially the sections of burial structures and tombs have been associated with human activities from the Turkic period. However, the graves under study had similar exterior surface structures mounded by an oval or circular stone construction with a diameter of 6–8 m, reflecting a standard tomb of the Xiongnu period. Pottery fragments L-EVA1201 and associated sedimentary samples L-EVA-1202 and L-EVA-1203, L-EVA-1204 from nearby sites ‘MKC 65’ (layer 2) and ‘MKC 4’ (layer 1) were collected taken for single grain measurements (Table S1). The single-grain OSL ages obtained on pottery are compared with single-grain results from sedimentary quartz that revealed post-depositional mixing due to human activities, during the re-using or re-opening of the burial at a later period, which is known to have occurred during the 5th–6th century AD (Unpublished Master Thesis Tengis S. 2017)
Sample preparation and measuring facilities
Sample preparation and luminescence measurements were carried out in the Luminescence laboratory at the MPI for evolutionary anthropology, Leipzig (Germany) and followed the standard procedure reported in (Solongo et al., 2019).
Single grains of quartz were measured using a Risø TL-DA-20 reader (Bøtter-Jensen et al., 2003) fitted with a single grain attachment. A 10 mW Nd:YVO4 solid-state diode-pumped green laser was used for quartz single-grain stimulation, and the signal was detected through Hoya U-340 filters. A 130 mW infrared (IR) diode emitting at 870 ± 40 nm was used for IR depletion test.
De determination
To obtain De for quartz, the SAR protocol (Murray and Wintle, 2003) was applied to individual grains, which measures the natural signal (Ln), a series of regenerative dose signals (Lx) of 5, 7.8, 12, 15.6, 0 and 5 Gy, and their corresponding test dose signals (Tx). The equivalent dose De has been determined using the initial 5–7 channels – signal integrated during the fast decaying part of the OSL decay curve with an appropriate background subtracted. To estimate the decay rates of the fast and medium components, the natural OSL signal (N) and the natural test dose OSL signal (Tn) are fitted to a sum of first-order exponential components using Origin 8.0, running a Levenberg-Marquardt algorithm.
Grains were rejected if the resulting OSL data failed to satisfy the criteria similar to those proposed by (Jacobs et al., 2006), namely if: the relative uncertainty on the first test dose signal TN was less than three sigma above its corresponding background or its relative standard error is >20%; the recycling ratio is >10%, and the recuperation is >10% of LN/TN; (C) the LN/TN value exceeded the laboratory-measured dose-response curves; OSL / IRSL depletion ratio differed from unity by more than two sigma and the TL110°C test. To check for the presence of feldspar, an IR depletion-ration test applied to the aliquot was incorporated at the end the SAR sequence (using an IRSL exposure for 100 s at 20°C). The incorporation of TL test to check whether the feldspar component is present involved checking TL whether the range of 150–220°C is at the background level (e.g. Solongo et al., 2019; Hu and Li, 2019).
. RESULTS AND DISCUSSION
Quartz OSL characteristics
Quartz pottery single grains
Fig. 1 presents the luminescence characteristics of three representative quartz grains from the pottery sample L-EVA1201. Thermal treatment and annealing of quartz might introduce enhancement in the luminescence sensitivity of annealed quartz (Bøtter-Jensen et al., 1995), and be associated with changes in the defect structures and populations (Poolton et al., 2000) and strong enhancement of the UV emission (Martini et al., 2014). For this quartz L-EVA1201, grain-to-grain variations were negligible. Altogether 300 grains were measured, as expected, the majority of the dose estimates (60%) were accepted and the remaining 120 grains were rejected owing to the lack of an OSL response to the test dose only. The representative natural OSL, test dose OSL and test dose OSL decay curves after IR bleaching at the end of SAR sequence stimulation are shown in Fig. 1b, 1d, 1f. The signal response to IRSL at the end of SAR was negligible confirming that the grains from aliquot are not IR-sensitive; in addition, the presence of the TL 110°C peak further confirms the absence of feldspar. LM-OSL conducted on a single grain identified dominant fast component (Fig. 1c).
Fig. 1
The dose-response curves for individual quartz grains of the heated quartz sample L-EVA1201, showing Lx/Tx as a function of regeneration doses. The corresponding luminescence decay curves from the individual grains are shown on the right side: natural OSL (N – black line), test dose (T1 – red line and T after IRSL – blue line) OSL decay curves as a function of stimulation time obtained from single grains. In addition, the corresponding TL measured from the aliquot at the end of the SAR protocol served as additional criteria for examining the presence of feldspar.
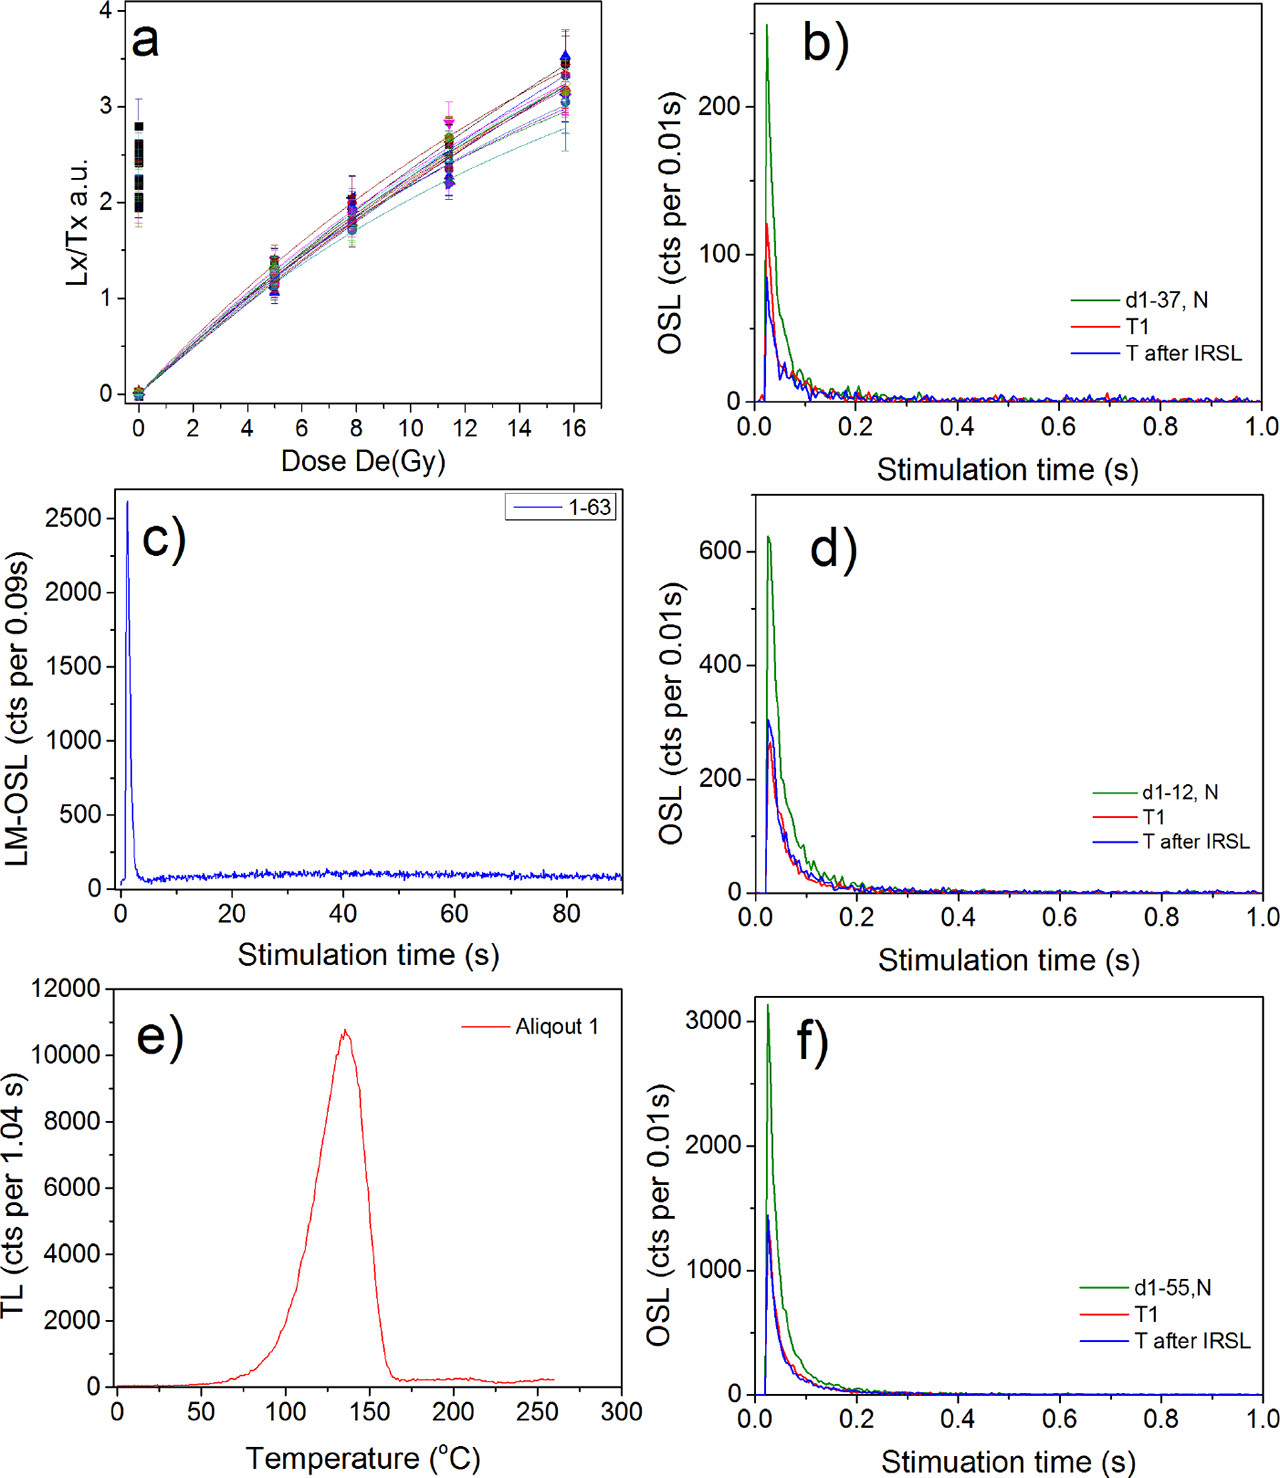
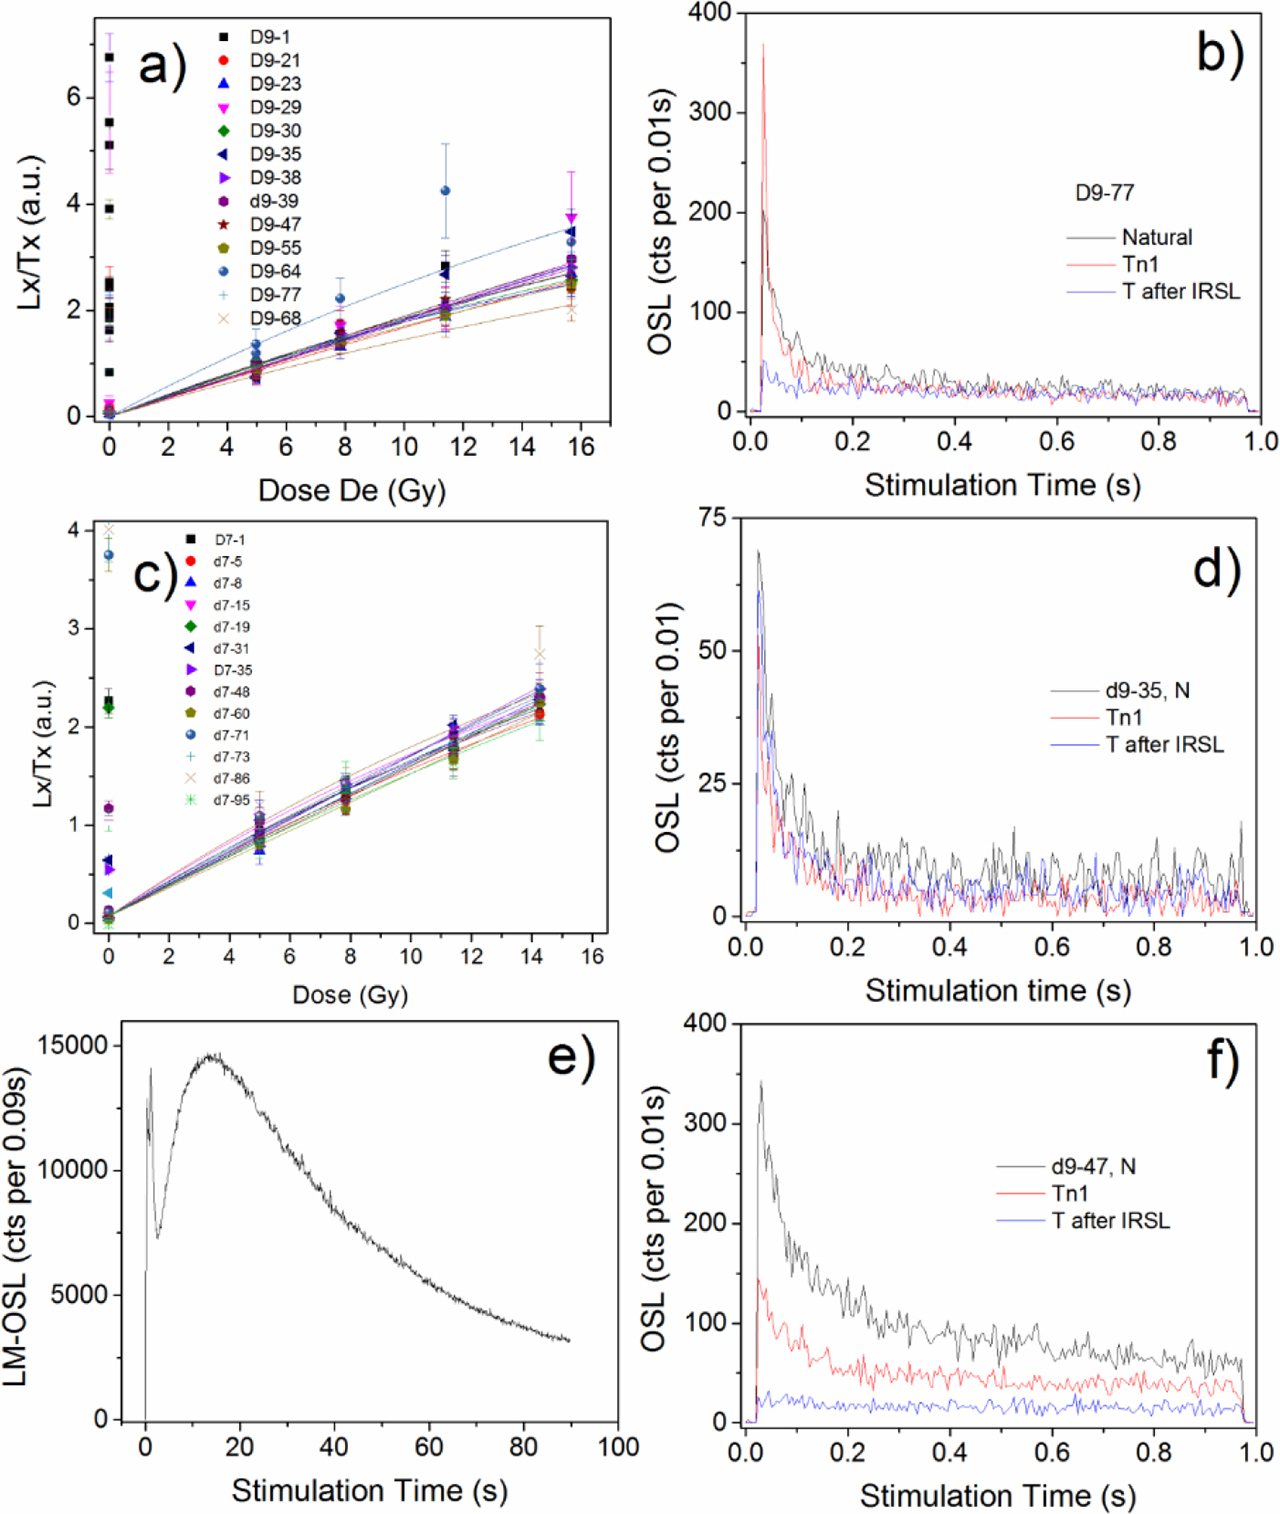
Fig. 2
a) and c) The dose-response curves for individual quartz grains of the sedimentary quartz L-EVA1202, showing Lx/Tx as a function of regeneration doses. The corresponding luminescence decay curves from the individual grains are shown on the right side: natural OSL (N – blue line), test dose (T1 – red line and T after IRSL – blue line) OSL decay curves as a function of stimulation time obtained from single grains. In addition, LM-OSL from a bright grain (e) indicated the presence of a significant slow component in addition to the fast component; however those bright grains were rejected.
For each grain, the sensitivity-corrected regenerated OSL signals (Lx/Tx) were fitted with a single saturating-exponential function in the form:
where I is the luminescence intensity, Imax is the intensity at saturation, D – dose, and D0 – the characteristic dose where the intensity Imax is (1–1/exp) times the saturation value. We have obtained values for Imax of 5 to 16 and D0 values of 24 to 70 Gy. In addition, a global fitting procedure (Fig. 1a) was used to a selection of single grains by fitting a single saturating exponential function; the D0 values obtained being between 16 and 40 Gy and the equivalent doses between 8 to 12 Gy.Previously, Roberts and Duller (2004) reported for multi-grain Imax values of 36 to 52 and D0 values as low as 38.6–55.1 Gy. However, Burbidge et al. (2006) studied younger samples and their values of Imax and D0 were all lower than those of Roberts and Duller (2004), and they argued that this may because the maximum regenerative dose of 64 Gy was half of that used by Roberts and Duller (2004). In our experiments, the maximum regenerative doses were of 15.6 Gy and 30 Gy, respectively. According to the recommendation of Wintle and Murray (2006), the equivalent dose values of more than 2D0 should be rejected because of high uncertainty, and the De's obtained from SAR and global fitting were less than 2D0.
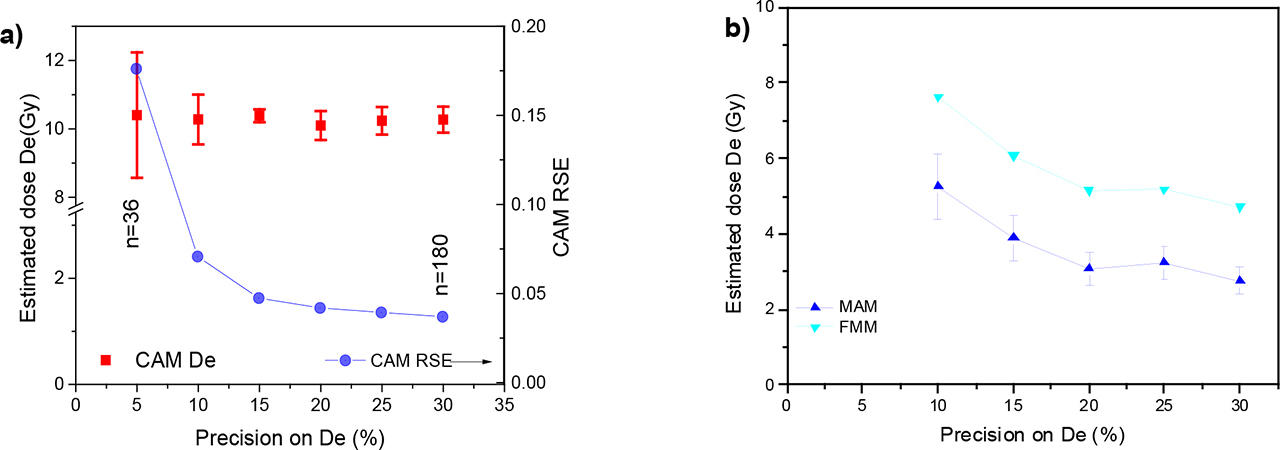
Following this first analysis, we calculated the dose estimates obtained when the relative uncertainty on the natural test dose, and the error in De, were less than 30, 20, 15 and 10%, respectively. The effect of the precision on the resultant De is shown in Fig. 3a where the estimated dose De is plotted against the precision on De. As can be seen from the figure, the application of this criterion does not significantly change the CAM De (Galbraith and Roberts, 2012) of the distribution. However, the relative spread in De values increases as higher precision constraints are applied and results in a significant increase in the relative standard error of 2.7% to 7.5%, as the number of accepted grains meets acceptance criteria decreased from 180 to 65. The over-dispersion OD value reduced from 11.2 to 9.9 ± 0.2%. The most precise estimates (5%) lead to the relative standard error of 15%, which is due to the statistically irrelevant number of grains (n=36).
Sedimentary quartz single grains
For the sedimentary samples L-EVA1202 and L-EVA1203, the quartz grains exhibit significant grain-to-grain variability in terms of OSL decay rate and inherent brightness. The sensitivity of sedimentary quartz grains has been suggested to be associated with different factors such as the source of origin of the mineral grains (Fitzsimmons, 2011), and their sedimentary/thermal history (Sawakuchi et al., 2011). Altogether 500 grains of L-EVA1202 were measured from which 149 grains (29.8%) were accepted. For representative ‘dim’ grains from the sedimentary quartz L-EVA1202 that passed the acceptance criteria, the natural OSL, test dose OSL and test dose OSL decay curves after IR stimulation are shown in Fig. 3b, 3d, 3f.
The dose-response curves of a selection of grains (L-EVA1202, Fig. 3a, 3c) were fitted using a global fitting procedure, however for some grains fitting was done by a linear equation. We obtained the values for Imax from 6 to 28 and for D0 from 25 to 82 Gy, which is higher than for pottery. Most importantly, the relative scatter in De for the sedimentary quartz is substantially higher than for the pottery and De values range from 4.2 ± 0.4 Gy to 37.3 ± 2.5 Gy. We believe the scatter is due to the following different sources: (i). grain-to-grain variations in luminescence properties; (ii). heterogeneous bleaching of grains, and post-depositional mixing of grains from different sources; and (iii). inhomogeneity in dose rate due to variations in 40K concentrations (Guérin et al., 2015).
Similarly, we calculated the dose estimates for precision in De of 30, 20, and 10 %, respectively. For sedimentary sample L-EVA1202, it seems reasonable to assume that the sample is probably affected by incomplete bleaching or post-depositional mixing. Therefore the MAM and FFM De's are analysed, as shown in Fig. 3b. It is a trend to observe that both the MAM De and FMM De values increase as higher precision is applied, and the number of accepted grains decreases from 146 to 53. It is noted that FMM De values yielded 5.14 ± 0.38 Gy that are consistent with for precision at 15, 20, and 30%. In contrast, the probably the well-bleached grains with the highest precision (error on De < 10 %) yield higher values of 7.64 ± 0.38 Gy.
It is worth to note that 51 grains (with signals up to 30,000 cts in the first 0.035 s of stimulation of the natural signal) were registered; however, these bright grains failed the rejection criteria; specifically, the sensitivity-corrected natural signal does not result in a finite dose estimate. In addition, the bright grains failed the TL 110°C test and the IR depletion test, suggesting the presence of a feldspar component. The LM-OSL measurements from a bright grain (Fig. 3f) indicated the presence of a significant slow component in addition to the fast component; this is in contrast to pottery grains, where the presence of a dominant fast component was confirmed. However, the detailed investigation of those bright grains using LM-OSL is beyond the scope of this paper.
Presence of an ultrafast quartz OSL component
The addition of the ‘fast ratio’ (Durcan and Duller, 2011) and thus removing the grains with low fast ratios as a criterion for selecting single grains for dose estimation was proposed recently (Duller, 2012); however, it might also lead to the removal of a high proportion of signals (Thomsen et al., 2016). The application of “fast ratio” by calculating the ratio between the fast and medium bleaching components for each grain from both datasets was tested here.
The results of the fitting showed up to three components with decay rates on average of 53 ± 1 s−1, 13.4 ± 0.7 s−1 and 1.2 ± 0.2 s−1. Our results are in agreement with the decay rates of 10.3 ± 3.4 s−1 for the fast and 2.1 ± 0.7 s−1 for the medium components reported by (Feathers and Pagonis, 2015), and of 11 ± 4.3 s−1 and 1.9 ± 1.0 s−1 obtained by (Duller, 2012). We assume that the additional component with the decay rate of 56.6 ± 2.4 s−1 obtained in our measurements may correspond to a very rapidly decaying ultrafast OSL (UF component) in quartz samples, reported earlier for multi-grain OSL by (Jain et al., 2008).
This ultrafast component was identified in samples from different areas around the world, and the optical cross-section of the responsible trap under blue light stimulation is about 14 times larger than that of the fast component (Jain et al., 2008). For dating, the authors suggested removing the UF component by IR bleaching above room temperature, removing by high preheat temperature (>200°C) or rejection of the very initial OSL signal. Interestingly, the preheat did not remove the hypothesised UF component; SAR protocol used in our studies employed preheat at 260°C and cut heat at 220°C, and these preheats are assumed to be high enough to remove the UF component (Jain et al., 2008). This implies that this UF is a) different to Jain et al.'s (2008) and b) that is reasonably thermally stable. Further tests are needed, e.g. high-temperature IR sine IR stimulation at room temperature did not impact the UF. The only evidence that this is a component other than the fast component is the fitting results and the proof of an additional component to the previously reported one.
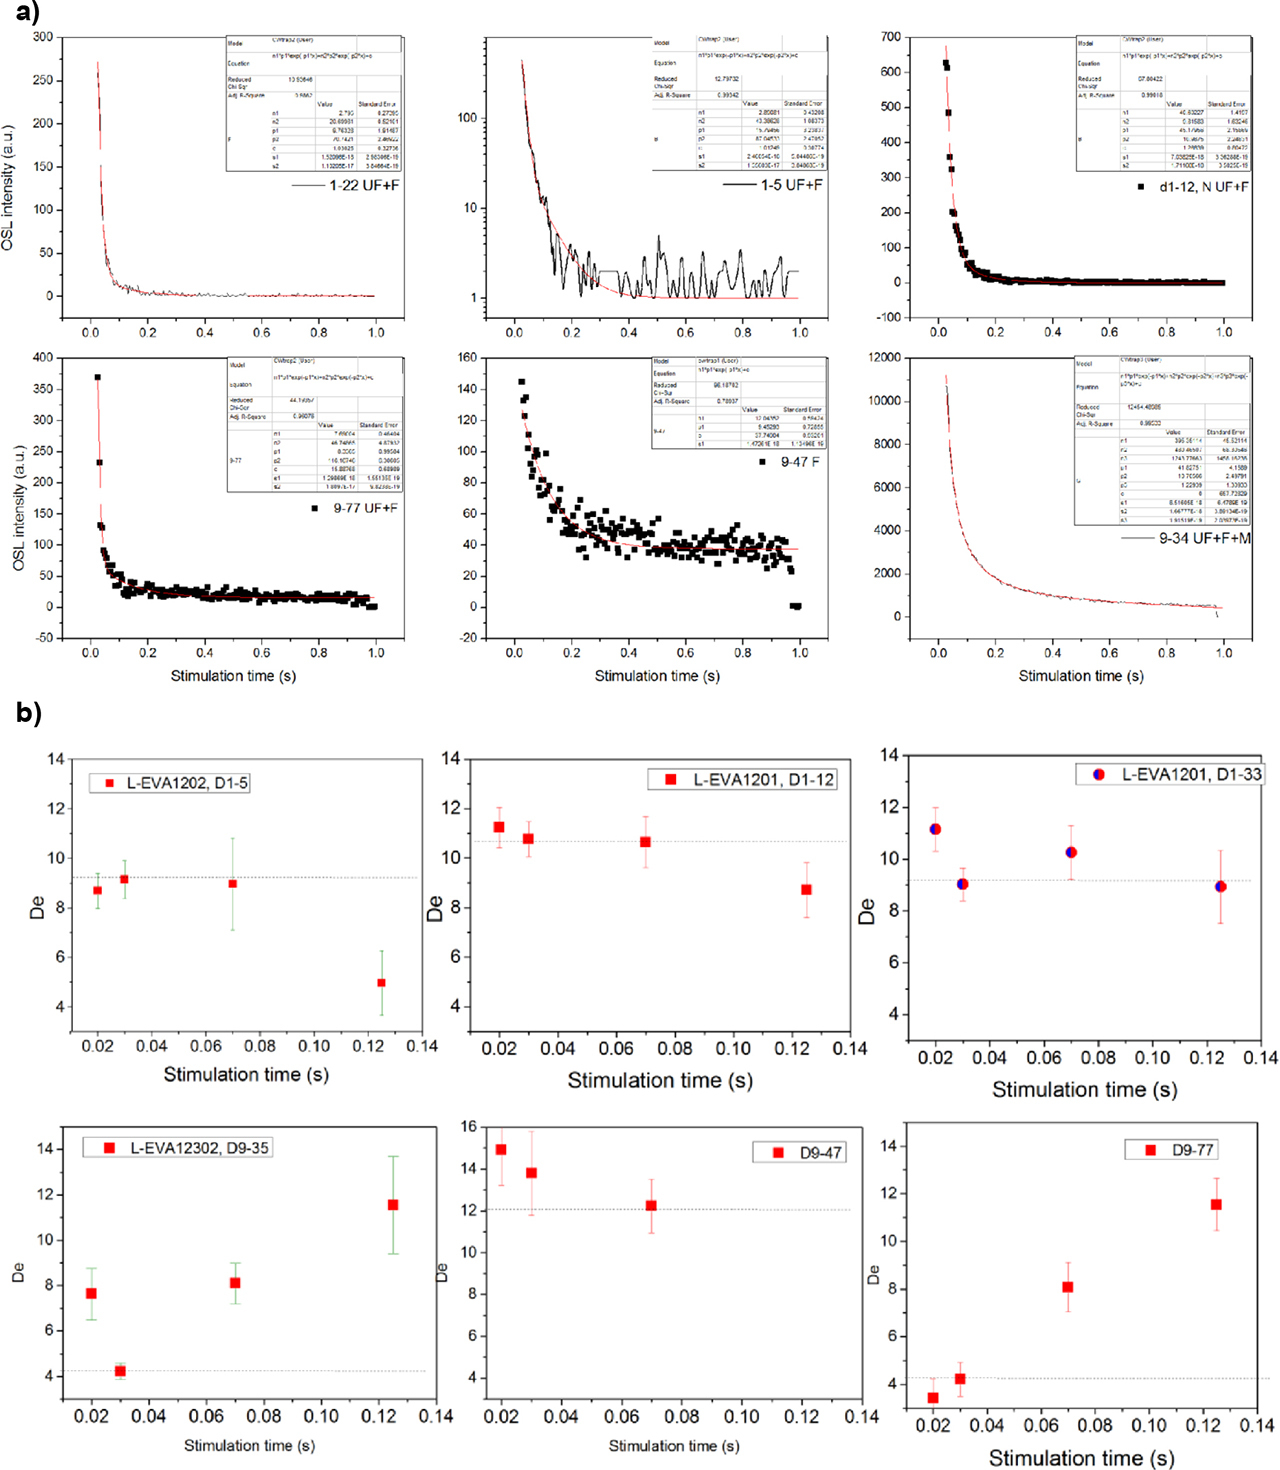
The initial OSL signal integration interval is assumed to include the fast component preferentially, and rejection of the very initial OSL signal might remove the UF. In the following we examined the effect of variation for the integration intervals on De estimation i.e. using the initial part (0.025 s, i.e. channels 6–7) for ultrafast and by rejecting the initial part (integrating 0.03–0.035 s, i.e. channels 7–9) of stimulation to isolate the UF and fast components.
The results are displayed in Fig. 4. We examined the effect of variation for the integration intervals on De estimation for pottery L-EVA1201, and for sedimentary quartz LEVA1202 and the corresponding using the De-t-plots are shown.
De estimates using UF and fast components as radial plots
Comparison of growth curve and radial plots
Fig. 5 compares growth curves for pottery L-EVA1201 and sedimentary L-EVA1202. For pottery, the growth curve was fitted by a single saturating exponential function of y=5.8[1–exp /20.9], whereas the sedimentary quartz was fitted using a linear function y=0.03+0.19x.
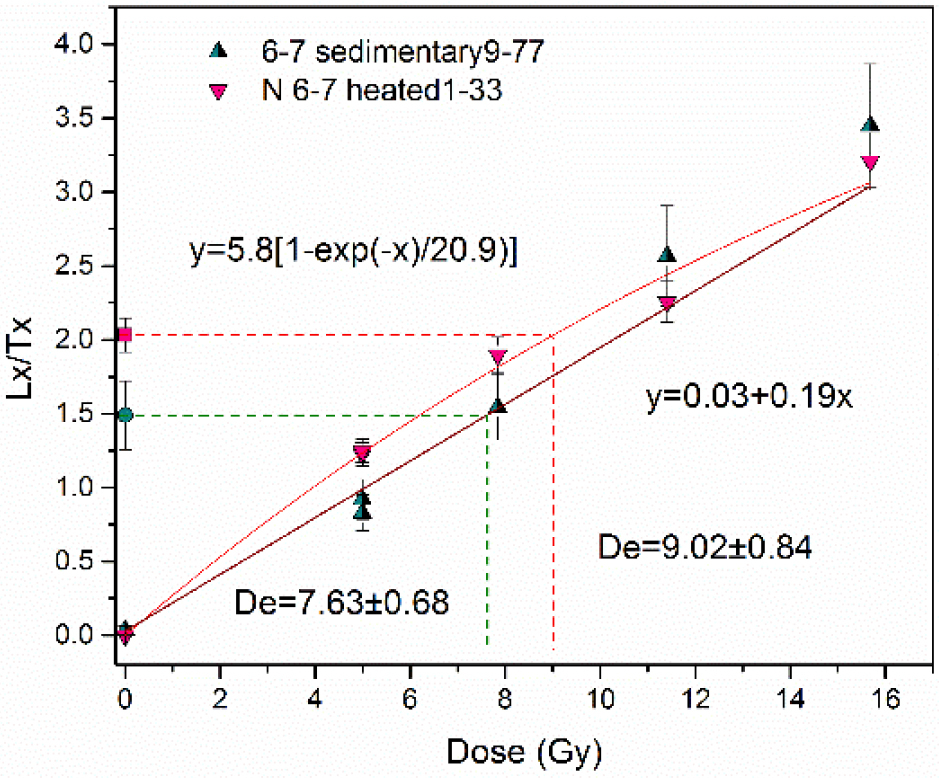
Fig. 6a displays a radial plot; the CAM De derived from the ‘fast’ and ‘ultrafast’ components were 9.8 ± 0.2 Gy and OD=14.7% which is consistent with the CAM De of 9.9 ± 0.1 Gy and OD=15% for UF.
Fig. 6
Radial plots of the single grain dose distributions a) fast De from accepted 167 grains (closed triangles) for heated quartz L-EVA1201 and UF De from n = 159 (circles). The solid grey band is centered on the weighted mean, De determined using Central Age Model, over-dispersion of 14.7%. b) De from accepted 134 grains of L-EVA1202 channels 6–9. The solid grey lines indicate the CAM De = 15.13 ± 1.47 Gy and overdispersion of 96.8%. MAM De = 5.91±1.38 Gy.
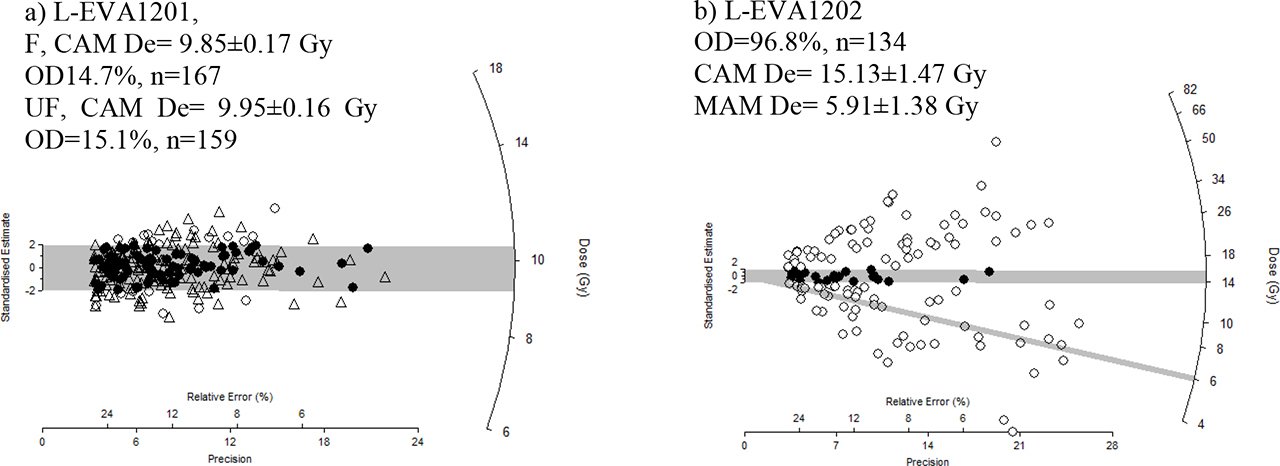
In contrast, Fig. 6b shows radial plot; n=135 out of 500; CAM De is 15.1 ± 1.5 Gy with OD=96.8%, suggesting the use of MAM De which is 5.9 ± 1.3 Gy.
. CONCLUSIONS
The archaeological site at the Khutag Uul Mountains (Mongolia) was investigated using single-grain quartz OSL on pottery and sedimentary samples. Detailed luminescence investigations revealed a presence of an ultra-fast component – not detected previously in the single grain measurements – which might lead to erroneous ‘fast ratio’ estimates. As the fitting results of pottery quartz display, fitting was done using ultrafast, fast plus background. It is worth mentioning that the introduction of the third component, namely the medium or slow component did not improve the fit and was equal the background. For the sedimentary quartz grains, fitting was done using a combination of ultrafast and medium with a small fast contribution, whereas the other datasets were fitted using fast and medium components only. Therefore, it was impossible to obtain fast ratio values for the whole dataset.
The CAM De derived from the ‘fast’ and ‘ultrafast’ components were 9.8 ± 0.2 Gy and OD=14.7% which is consistent with the CAM De of 9.9 ± 0.1 Gy and OD=15% for UF. In contrast, for sedimentary quartz where the MAM De and FMM De were taken into consideration, rejecting the initial part in order to remove the UF lead to reduce the number of selected grains, which might thus lead to a loss of robustness in the final results.