
. INTRODUCTION
Determination of deposition ages of sediments and radiation dosimetry are the primary applications of the luminescence dating method (e.g. Aitken, 1998; Rittenour, 2018; Yukihara and McKeever, 2008). Recently, new applications have been extended to the field of sedimentary source identification and apportionment. Here the sensitivity of the detrital quartz to laboratory radiation is measured by means of thermoluminescence and optically stimulated luminescence. Initial studies show that deserts distributed in western and eastern China can be well separated by the luminescence sensitivity of sand-sized quartz (Li et al., 2007; Zheng et al., 2009). This approach is subsequently applied to other deposits such as loess, fluvial sediments, marine sediments and fluvial sediments and proved to be a useful tool for provenance investigations (Pietsch et al., 2008; Lü and Sun, 2011; Sawakuchi et al., 2011, 2012, 2018; Tsukamoto et al., 2011; Lü et al., 2014; Qiu and Zhou, 2015; Zular et al., 2015; Nian et al., 2019).
Quartz luminescence sensitivity represents the efficiency with which the mineral stores the energy received from the radiation and subsequently, upon stimulation, converts the stored energy into luminescence. It can be quantified by the light intensity generated by unit dose of laboratory irradiation and unit mass. Luminescence sensitivity of quartz in sediments is mainly controlled by two factors. First, it is intrinsic to the property of the parent rocks (Preusser et al., 2009; Wintle and Adamiec, 2017). The crystallization processes, thermal and radiation history of the host rocks determine the crystal structure of minerals, as well as the concentration and types of intrinsic defects in quartz crystal, hence influencing the quartz luminescence sensitivity (Preusser et al., 2009; Sawakuchi et al., 2011; Jeong and Choi, 2012; Sanderson and Kinnaird, 2019). The second factor is the sediment transport history. Experiments in the laboratory show that irradiation, heating and bleaching processes can lead to changes in luminescence sensitivity (e.g. Zimmerman, 1971; Zhou and Wintle, 1994; Vartanian et al., 2000; Zheng et al., 2009; Nian et al., 2019). Under natural conditions, similar processes which occur during the sediment transportation can influence the quartz luminescence sensitivity as well. The longer distance the quartz grains are transported, the more cycles the quartz grains experience and the higher luminescence sensitivity becomes during the source-to-sink routing processes (e.g. Preusser et al., 2006; Pietsch et al., 2008; Fitzsimmons, 2011).
As the quartz grains from various sources and with different sediment transport histories display different luminescence sensitivity, the quartz luminescence sensitivity can serve as a potential indicator for the sediment provenance (e.g. Li et al., 2007; Zheng et al., 2009; Sawakuchi et al., 2011, 2018; Nascimento et al., 2015), or reflect the source variation for the sediments (Sawakuchi et al., 2012; Zular et al., 2015; Chang and Zhou, 2019). Loess is one of the most typical aeolian deposits, which is formed by the accumulation of wind-blown silts. Measurements of the luminescence sensitivity of quartz in loess of Chinese Loess Plateau show systematic variations between loess and paleosol units which are interpreted as reflecting changes in the provenance controlled by the glacial/interglacial transitions (Lü and Sun, 2011; Lü et al., 2014).
Central Asia is one of the largest loess deposition areas in the world (Dodonov, 1991; Dodonov and Zhou, 2008). Here, silty materials are transported by the westerly wind (Dodonov, 1991; Smalley et al., 2006). Previous luminescence studies in this area have focused on the dating of the loess-pedocomplex sequences and properties of luminescence signals from the loess samples (Frechen and Dodonov, 1998; Zhou et al., 2010). To further test the applicability of the luminescence sensitivity as a tool for provenance study, this study sets out to investigate the characteristics and temporal variation of the luminescence sensitivity for the quartz grains from two loess sections in southern Tajikistan, Central Asia. Laboratory experiments are designed to simulate various sedimentary processes and to better understand their effects as controlling factors for the luminescence sensitivity. Based on the results obtained, mechanisms that consider the influence of both the rock property and subsequent sedimentary changes on the quartz luminescence sensitivity are discussed.
. GEOLOGICAL SETTING
The Alay mountain range extends from Tien Shan westwards in a belt over 1000 km and divides the lower area of Tajikistan into northern and southern regions. The other principal mountain in Tajikistan is the Pamir Plateau, which dominates the eastern half of the country with an average elevation higher than 4000 m.
The climate in the region is continental, and the mid-latitude westerlies are a vital driving force in transporting moisture to Central Asia (Vandenberghe et al., 2006; Caves et al., 2015). The precipitation is high in spring and winter, and low in summer and autumn.
Loess accumulation in Central Asia is closely related to the geomorphic, geographic and atmospheric conditions in this area (Dodonov, 1991; Ding et al., 2002; Vandenberghe et al., 2006). Silt materials produced mainly by physical weathering, including glacial grinding, frost weathering and thermal weathering were transported by the fluvial-runoff from the mountains to the deflation zone (Smalley, 1966; Dodonov, 1991). The silt materials were then lifted by the dust storms and carried by westerly wind to the east and deposited in piedmont (Dodonov, 1991; Machalett et al., 2006; Smalley et al., 2006; Youn et al., 2014). The loess and pedocomplex units were formed during the glacial and interglacial periods respectively, and their alternation is controlled by global ice volume variations (Shackleton et al., 1995; Ding et al., 2002).
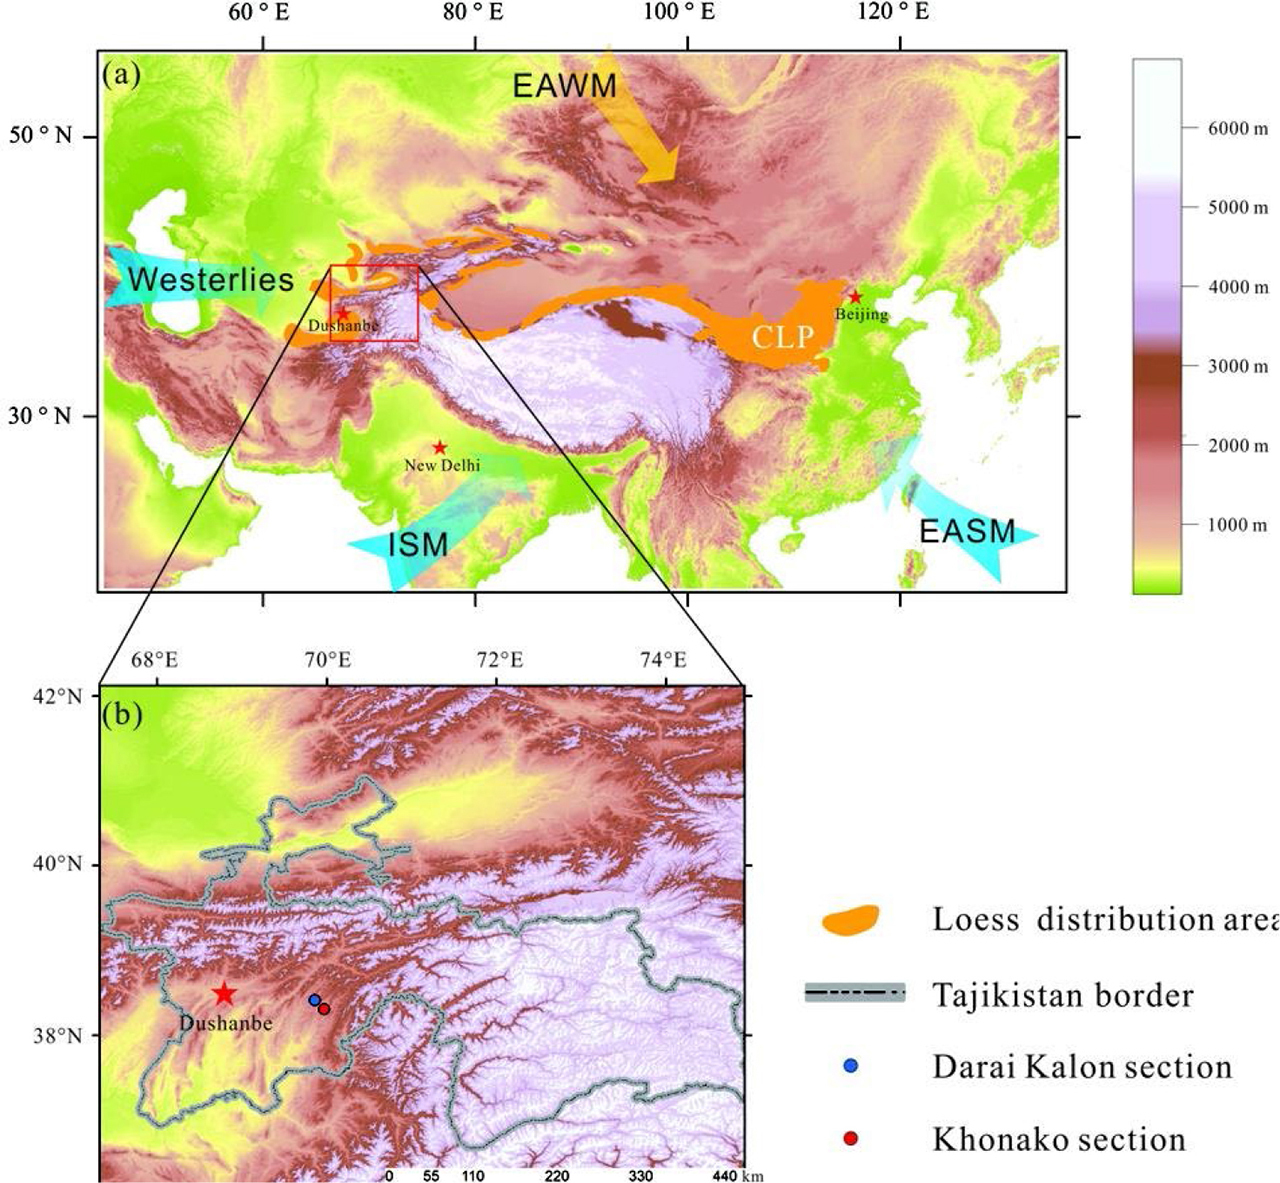
Khonako and Darai Kalon loess sections which are located in piedmont of western Pamir Plateau with an approximate altitude of 2000 m represent two of the most typical and complete loess-paleosol profiles in this area (Fig. 1b). The thickness of both sections are over 100 m and nine paedocomplexes separated by loess units are formed in the Brunhes epoch (Dodonov and Baiguzina, 1995; Dodonov et al., 1999). These two loess sections are located in the intermontane basin belonged to the Karakum block, which borders the southern Tien Shan orogenic belt to the north and Pamir terranes to the southeast (Li, 2010).
Fig. 1
(a) Elevation map showing the loess distribution area in Central Asia and Chinese loess plateau (CLP), main capital cities, and climate driving forces in Asia including EASM (East Asian summer monsoon), EAWM (East Asian winter monsoon), ISM (Indian summer monsoon) and westerlies. (b) Map showing the location of Khonako and Darai Kalon sections in Tajikistan.
The strata of the Pamir terranes are mainly composed of the Precambrian metamorphic basement, Palaeozoic (mainly Neopaleozoic) to Mesozoic sedimentary rocks and Palaeozoic to Cenozoic igneous rocks (Chapman et al., 2018). The lithology of the metamorphic basement includes gneiss, schist, amphibolite, marble and quartzite. The main types of igneous rocks are granite and granodiorite. Besides, the Pamir gneiss domes with a large area containing amphibolite-facies sedimentary and igneous rocks buried, metamorphosed and exhumed in the Cenozoic are distributed in the Pamir terranes (Robinson et al., 2004, 2007; Rutte et al., 2017). The Precambrian metamorphic basement rocks are also exposed in the South Tien Shan orogenic belt, which are overlain by the strata of the Paleozoic sedimentary rocks. The intrusive rocks are mainly from Late Carboniferous to Early Permian, the main type of the intrusive rocks is granite (Ren et al., 2013). The diversity of source rocks in the study area provides a large amount of weathering products of complex compositions for loess deposition.
. MATERIALS AND METHOD
Sample preparation
In this study, 37 samples and 30 samples were collected from the Khonako section and the Darai Kalon section respectively, all from the loess unit L1 to pedocomplex PC2.
Samples were treated under subdued red light in the laboratory using the procedure of Qin and Zhou (2009). 30% hydrogen peroxide (H2O2) and 10% hydrochloric acid (HCl) were used to remove the organic matter and carbonate. Polymineral fine-grained fraction (4–11 μm) was separated according to Strokes’ Law. The >45μm fraction was obtained by wet sieving and 11–45μm fraction was also collected. Polymineral in these three different grain-size fractions were treated with 10% silica-saturated hydrofluosilicic acid (H2SiF6) to dissolve the feldspar and then subsequently washed by hot 10% HCl and deionized water to extract the quartz. The purity of the quartz was verified by the low ratio (< 3%) of initial IRSL to blue OSL signals.
Measurement procedures
All the measurements were performed using a Risø TL/OSL-DA-15 reader. The luminescence sensitivity of quartz was measured following the procedures of Zheng et al. (2009). Ten aliquots per samples were given a dose of ∼14.5 Gy after bleaching at room temperature using blue LED for 100 s, then the aliquots were heated to 220°C to measure the TL signal of the irradiation dose, the signal from 60°C to 120°C were integrated to provide the 110°C TL sensitivity. The OSL signal was then subsequently stimulated by blue light (470 ± 30 nm) LED (90% of 50 mW/cm2) at 125°C for 40 s. The heating rate in all thermal treatments is 5°C/s. The initial 0.64 s of the signal was integrated for sensitivity determination after subtraction of the signal of the last 3.2 s as the background. All the quartz grains on aliquots were weighted with a Sartorius BS300S analytic balance with a precision of 0.1 mg. The sample weight on each aliquot is about 1.5 mg.
The post-IR OSL procedures have also been performed on the polymineral grains; the natural signal was bleached with blue light at room temperature for 100 s. Then a laboratory irradiation dose of ∼63.4 Gy was given. After preheating at 240°C for 10 s, the IRSL and OSL signal were subsequently measured at 50°C and at 125°C for 100 s, respectively. The signal of initial 3.2 s were integrated after subtraction of the signal of the last 20 s as the background. The ratio of IR intensity to OSL intensity was then calculated. This ratio is considered to reflect the relative content of feldspar and quartz, which is interpreted as indicating the degree of chemical weathering (Wang and Miao, 2006; Sawakuchi et al., 2018).
The frequency-dependent magnetic susceptibility was measured using the Bartington MS2 Susceptibility Meter (e.g. Zhou et al., 1990). The median grain size of the studied samples was obtained with the measurements using a Malvern Mastersizer 2000 laser particle size analyzer.
The thermal activation experiments were carried out to investigate the quartz luminescence characteristics (Aitken, 1985). Following the procedures of Zheng et al. (2009), the aliquots were bleached with blue light for 100 s, then each aliquot was progressively heated to a higher temperature from 200°C to 500°C with an increment of 20°C. The luminescence sensitivity was measured between each heat treatment after receiving the irradiation dose. At least four aliquots were measured for each sample.
The irradiation-bleaching cycles experiments were designed to investigate the effect of repeated irradiation-bleaching on the luminescence sensitivity. The aliquots were divided into six groups. All the aliquots were first bleached at room temperature with blue light for 100 s to eliminate the natural signals. Then the aliquots received repeated dosing/bleaching treatments. The irradiation/bleaching cycles were repeated for 5, 10, 15, 20, 50 and 100 times, respectively for different groups, followed by the measurements of the luminescence sensitivity.
. RESULTS
Quartz luminescence sensitivity
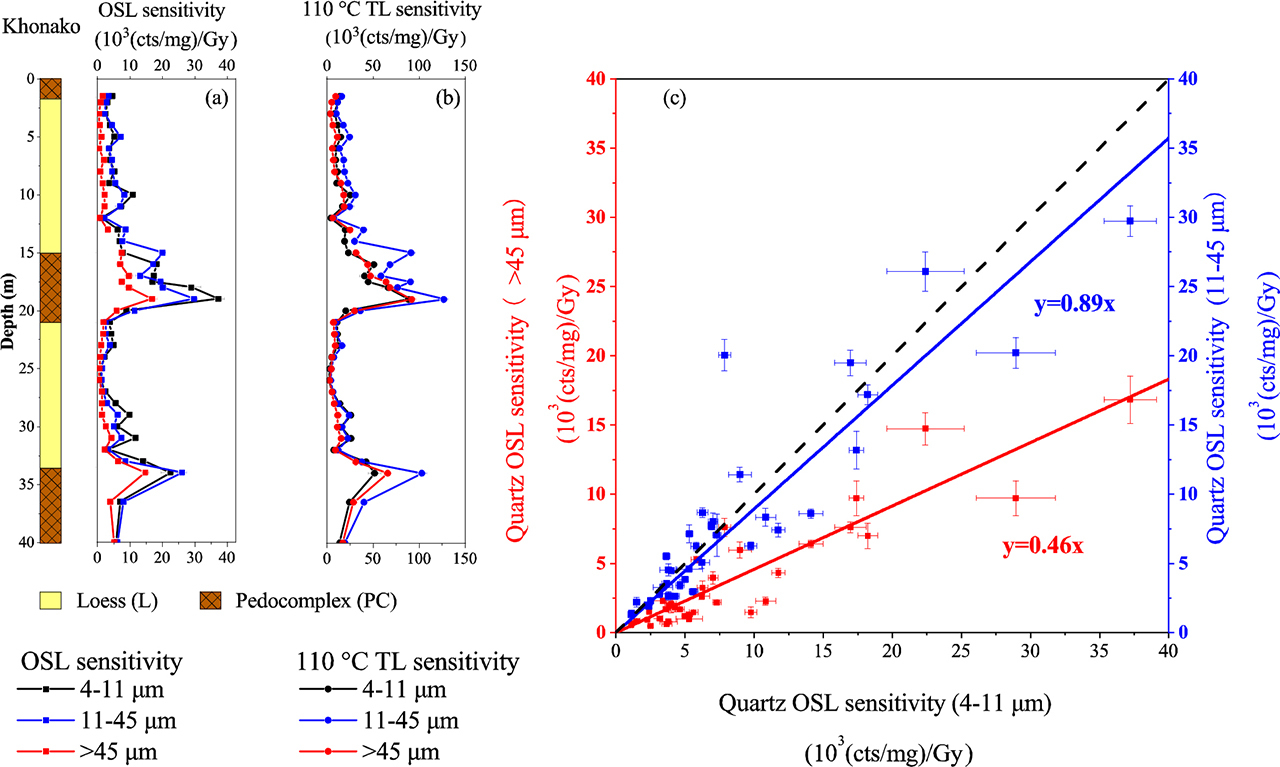
The down-profile variations in luminescence sensitivity of OSL signals (0–0.64 s) and 110°C TL signals for quartz grains of 4–11 μm are shown in Fig. 2. Luminescence sensitivity for most samples from pedocomplex units is higher than those from the loess units. The fluctuation of both the TL and OSL sensitivity is similar. Both the trend and amplitude of the variations are consistent between these two sections. The variations in the quartz luminescence sensitivity also parallel three climate proxies plotted in Fig. 2, the IR/[post-IR] OSL ratio, median grain size and frequency-dependent magnetic susceptibility (χfd), which clearly differentiate the pedocomplex and loess units. The variations of quartz OSL and 110°C TL luminescence sensitivity of different grain size fractions are generally consistent with each other (Figs. 3a and 3b). A plot of >45 μm and 11–45 μm quartz OSL sensitivity versus 4–11 μm quartz OSL sensitivity is shown in Fig. 3c. The blue and red lines with the slope of 0.46 and 0.89 respectively represent the linear fitting of the two data sets.
Fig. 2
Variations of 4–11 μm quartz OSL and 110°C TL luminescence sensitivity, IRSL/[post-IR] OSL ratio, median grain size and frequency-dependent magnetic susceptibility (χfd) for the samples from Khonako (above) and Darai Kalon (below) sections.
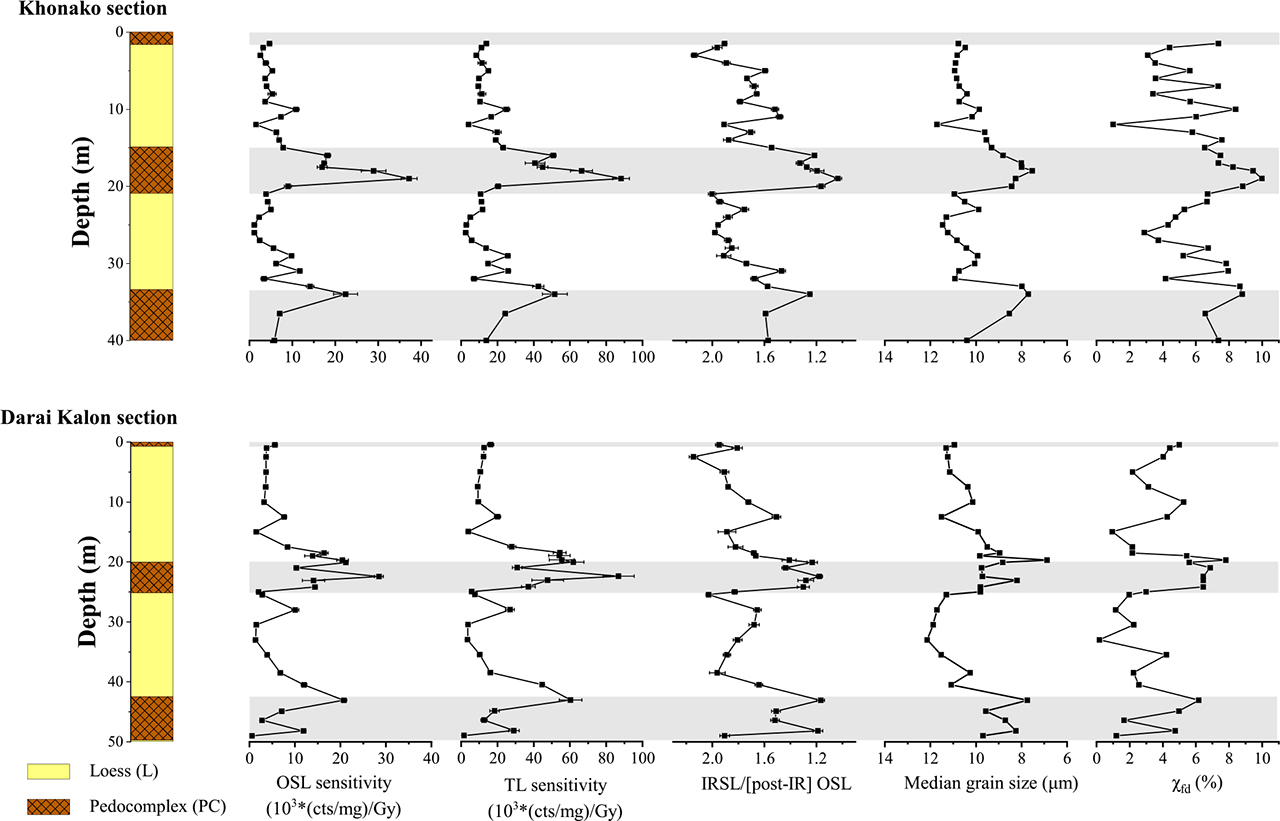
Fig. 3
Variations of the OSL and 110°C TL luminescence sensitivity for the different grain size fractions (a and b) and the plots of 11–45 μm and >45 μm quartz OSL sensitivity versus 4–11 μm quartz OSL sensitivity (c). The blue and red dots symbols represent the fraction of >45 μm and 11–45 μm respectively and the blue and red solid lines represent the linear fitting of the data. The black dashed line is 1:1
Thermal activation curves (TAC)
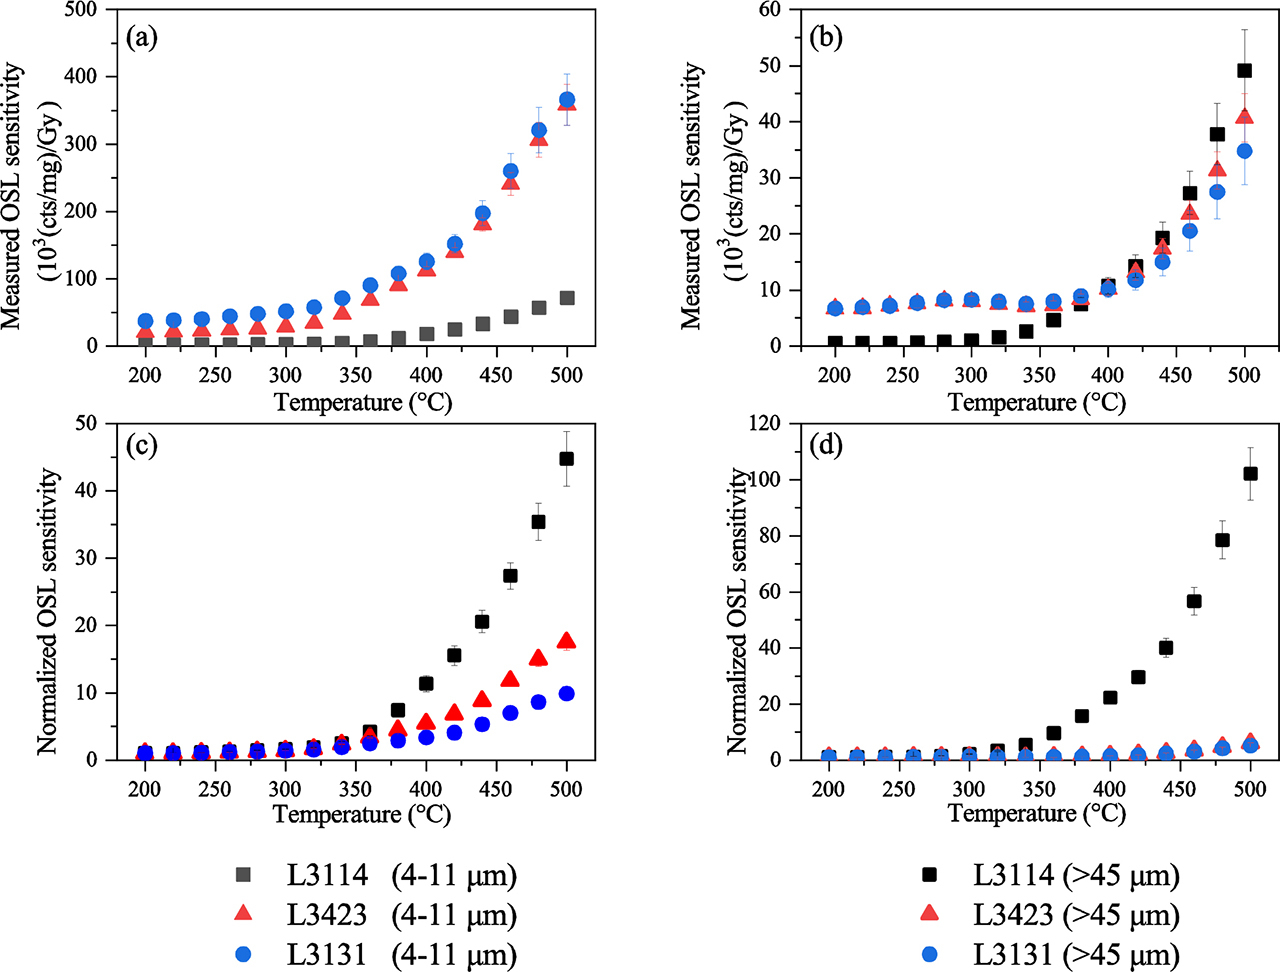
The thermal activation experiments have been performed on three samples taken from different depths and with different luminescence sensitivities. Sample L3114 from the top of loess unit L1 which corresponds to the last glacial maximum displays the lowest luminescence sensitivity (1.60 ± 0.08 103 (counts/mg)/Gy for 4–11 μm grains and 0.48 ± 0.06 103 (counts/mg)/Gy for >45 μm grains) among these three samples, while sample L3131 from the pedocomplex PC1 displays the highest value (37.2 ± 3.2 (103 (cts/mg)/Gy for 4–11 μm grains and 6.70 ± 0.70 (103 (cts/mg)/Gy for >45 μm grains). The OSL sensitivities for the quartz grains of 4–11 μm and >45 μm after progressive thermal activation are shown in Figs. 4a and 4c and the results after normalization to the initial sensitivity are shown in the Figs. 4b and 4d. The OSL sensitivity increases with the annealing temperature dramatically, especially when the annealing temperature is above 350°C. The OSL sensitivity of these three samples exhibits significantly different features in the thermal activation experiments. The amplitude of the enhancement in the OSL sensitivity displays an opposite trend to the initial OSL sensitivity. The sensitivity of the sample L3114 is increased 44.8 ± 4.1 times and 102.0 ± 9.4 times after thermal activation to 500°C for 4–11 μm and >45 μm grains respectively, much larger than the other two samples. For the sample L3131, which displays the highest luminescence sensitivity, the enhancement is 9.8 ± 0.6 times for the 4–11 μm grains and 5.2 ± 0.7 times for the >45 μm grains.
Effects of the repeated irradiation-bleaching treatment on the luminescence sensitivity
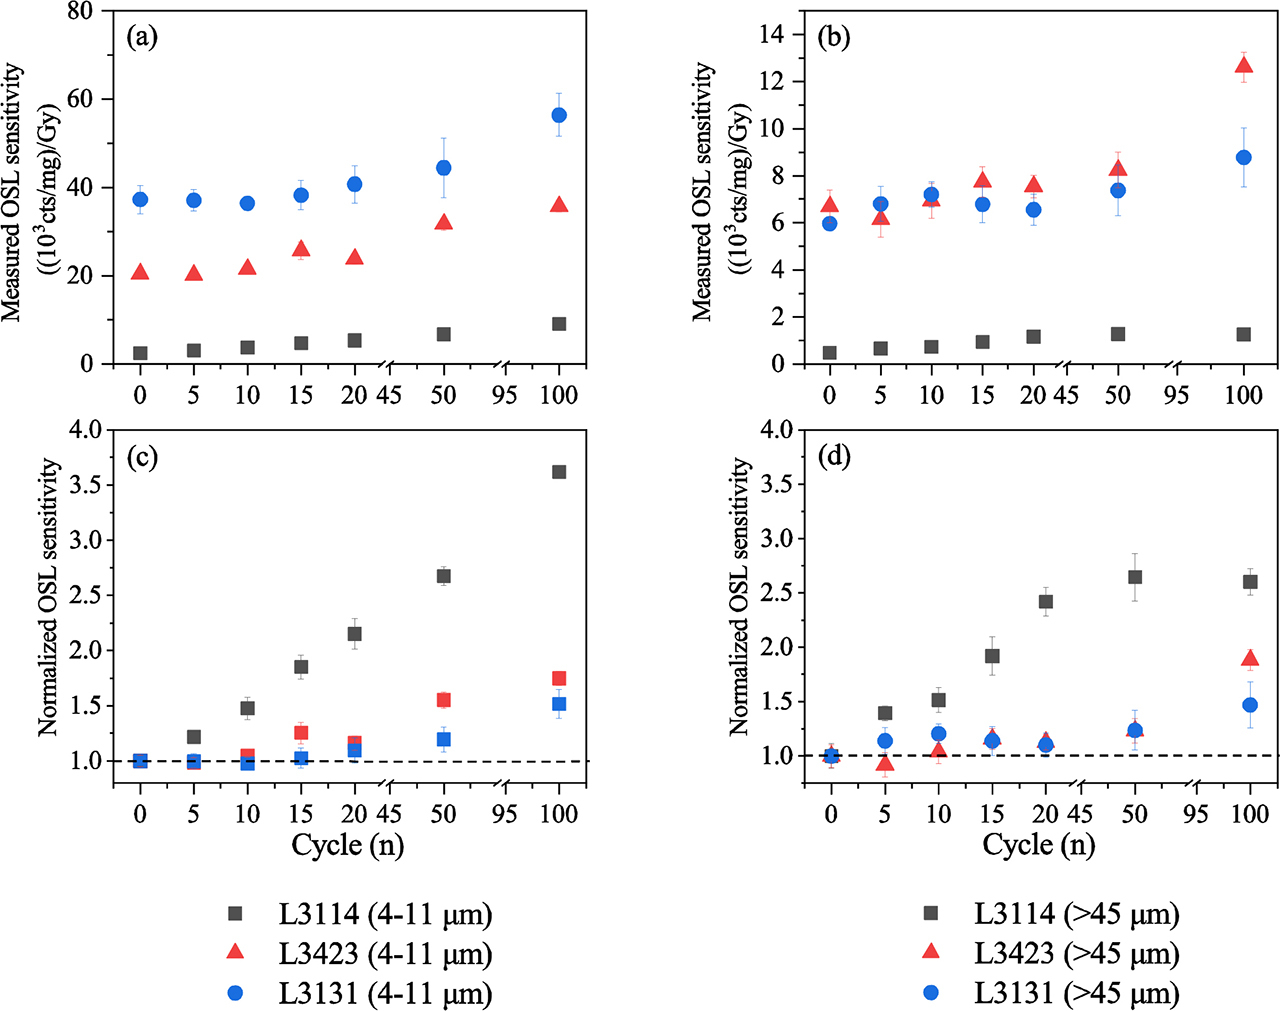
The quartz OSL sensitivities for these three samples after different cycles of irradiation-bleaching treatments are shown in Figs. 5a and 5b. Figs. 5c and 5d display the results after normalization to the initial sensitivity. There is a general increasing trend in the OSL sensitivity with the cycle times for all the three samples (Figs. 5a and 5b). The difference is clearly seen after the normalization (Figs. 5c and 5d). For sample L3114, whose OSL sensitivity is the lowest among the three samples, the OSL sensitivity of 4–11 μm and >45 μm quartz grains increases by 3.6 ± 0.1 and 2.6 ± 0.1 times respectively after 100 cycles of irradiation/bleaching treatment, which are much significant than observed in the other two samples.
Fig. 5
OSL luminescence sensitivity (0–0.64 s) measured after different cycles of irradiation/bleaching treatment for quartz grains of 4–11 μm (a) and >45 μm (b). Normalized sensitivity (normalized by the initial sensitivity) as a function of increasing irradiation/bleaching cycles for quartz grains of 4–11 μm (c) and >45 μm (d).
. DISCUSSION
The parallelism in the variations between the quartz luminescence sensitivity and climate proxies (Fig. 2) suggests a potential linkage between the quartz luminescence property and climate change. Similar parallelism was observed in Chinese loess deposits and a climate control on the source-to-sink distance and associated sedimentary cycling was proposed to explain the quartz luminescence sensitivity variations (Lü et al., 2014). However, unlike loess field in China, the source materials for loess in Central Asia are mainly from Tien Shan Mountain and Pamir Plateau and the dominant dust transporting wind in the source-transfer-accumulation system of loess deposition in southern Tajikistan is the westerlies (Dodonov, 1991; Smalley et al., 2006; Youn et al., 2014). Therefore, a mechanism responsible for the luminescence sensitivity difference documented here for the Tajik loess sequences must be sought.
Frequency-dependent magnetic susceptibility reflects the content of ultrafine-grained ferromagnetic minerals formed secondarily in the pedogenic process, which is most influenced by the temperature and humidity conditions at the deposition site (Zhou et al., 1990; Heller et al., 1991). The grain size of the loess reflects the wind strength and the relative source-to-sink distance (Pye, 1989; Machalett et al., 2008). The IRSL/[post-IR] OSL ratios is used to estimate the relative content of feldspar and quartz as result of chemical weathering (Wang and Miao, 2006; Sawakuchi et al., 2018), which may take place before or after deposition. All of the three climate proxies display clear discrepancy between the loess and pedocomplex units, which reflect climate change between glacial and interglacial periods. How could glacial-interglacial climate changes affect quartz luminescence sensitivity? The pedogenic processes, though involve energy transformation and element migration, are too weak to alter quartz intrinsic property that determines the luminescence sensitivity. By the same token, there is no obvious mechanism that allows the chemical weathering at the source or after deposition to alter the luminescence sensitivity. Constrained by the specific loess depositional system (Dodonov, 1991) and the relatively short distance between source and accumulation site as revealed by the analysis of the chemical compositions of the Tajik loess (Li et al., 2016), the changes in wind strength is also unlikely to cause significant difference in the source-to-sink distance between glacial and interglacial periods, thus unable to create contrast in quartz luminescence sensitivity. Apart from the direct effects discussed above, can the climate change play an indirect role in modulating quartz luminescence sensitivity during the production, storage, transfer, deposition and alteration stages throughout the loess and paleosol formation (Pécsi, 1990)?
As thermal activation curves reflect the activation energies distribution of the luminescence and non-luminescence centers (Aitken, 1985), which is determined by quartz types and is insensitive to the sedimentary history, they can be used to reflect the origins of quartz (Zheng et al., 2009, Zheng and Zhou, 2012; Nian et al., 2019, Chang and Zhou, 2019). The thermal activation experiment results presented in Fig. 4 clearly point to the fundamental difference in quartz genesis and source rock compositions for the samples representative of the two lithologies. As mentioned early, the study area is composed of strata with different ages and lithologies, which experienced complicated geological, thermal and radiation histories. The minerals including quartz must have experienced multiple diagenetic phase transformation, thermal and radiation exposure, erosion-sedimentation cycles during the long-term geological periods, which determine the lattice defect configuration associated with the state of electron and hole population (Sanderson and Kinnaird, 2019). Thus, the genesis of the quartz grains in the source rocks are complicated in Central Asia, so would be their luminescence characteristics. How could such complex source rocks systematically create differentiated materials between glacial and interglacial periods?
Source rocks must be weathered to produce materials for loess deposition. Weathering products in mountain areas of Central Asia are mainly produced by the mechanical processes in glacial environments and chemical processes are considered to be less significant (von Eynatten et al., 2012). During the glacial periods, physical weathering intensity would increase with the glacial advance (e.g. Hallet et al., 1996; Koppes and Montgomery, 2009; Herman et al., 2013). During the interglacial periods, the glacier would retreat. The increase in the temperature and rainfall can lead to the enhancement in the chemical weathering intensity (Lupker et al., 2013; Clift et al., 2014). The weathering intensity and patterns would then alternate between the glacial and interglacial periods. As such, the source available for aeolian deposition would undergo a systematic change between glacial and interglacial periods.
In addition, there is a much overlooked but important aspect of weathering, i.e. the difference in the resistance to weathering for different source rocks. The rate of weathering depends on the composition of the constituent minerals, as well as the rock structures (e.g. Pye, 1986; Labus, 2008; Israeli and Emmanuel, 2018). As the weathering rate is a function of climate and properties of the source rocks (e.g. Egli et al., 2003; Soreghan et al., 2015), the responses of both physical and chemical weathering rate to the climate changes for the rocks with different resistance are highly divergent (e.g. Römer, 2007; Eppes and Keanini, 2017), which could result in the changes in the composition of weathering products including the quartz genesis (Vogt et al., 2010; Lupker et al., 2013; Clift et al., 2014; Liu et al., 2013). These changes in the composition of the quartz grains weathered from different types of rocks within the same source area can lead to variations in the luminescence characteristic of quartz grains in the weathering products, and finally in the loess materials. Indeed, previous studies have found discrepancies in the quartz luminescence sensitivity between different rocks (e.g. Sawakuchi et al., 2011; Guralnik et al., 2015). Therefore the differentiation of the quartz genesis in the weathering products is considered as a primary mechanism to cause the contrast in the luminescence characteristics of loess and pedocomplex in the southern Tajikistan.
There is another sedimentary process that can specifically affect the quartz luminescence sensitivity, i.e. the repeated irradiation-burial-exposure during the storage and transfer stages of loess formation. In the laboratory irradiation-bleaching experiments shown in Figs. 5a and 5b, stronger sensitization in the luminescence sensitivity is observed for the sample with relatively low sensitivity. For the quartz grains with relatively high sensitivity, which probably have been sensitized in the field, the sensitization is limited (Fig. 5). During the glacial period, the physical weathering would enhance due to the intensive freeze-thaw weathering and glacial activity (Herman et al., 2013; Koppes and Montgomery, 2009), the amount of the fresh materials weathered from the bedrock would increase. This is likely accompanied by reduced cycles of the irradiation and bleaching and shorter storage time during the transfer stage. Loess deposited during the glacial periods will contain more freshly weathered materials and less sensitized quartz grains with lower luminescence sensitivity (e.g. Rhodes and Bailey, 1997; Richards, 2000; Thrasher et al., 2009). By contrast, during the interglacial periods, the physical weathering is weakened, and the amount of the newly weathered materials decreases, the proportion of the materials which have been transported for a long distance and received more irradiation and bleaching cycles will increase. So does the proportion of sensitized quartz grains. In this way, the shifts between the glacial and interglacial climate exert significant effects on the variations in the quartz luminescence sensitivity, as observed in the loess and pedocomplex units.
With the mechanisms described above to account for the variations in quartz luminescence sensitivity between the loess and pedocomplex units, one would also expect differences in the extent of sensitization for different grain sizes. Indeed, a comparison of the OSL luminescence sensitivity between the three size fractions reveals a decreasing trend with increased grain size (Fig. 3c). Additionally, the enhancement of luminescence sensitivity as a result of irradiation-bleaching cycles is lower in the coarser fraction than in the fine fraction (Figs. 5c and 5d). This could be due to the less irradiation-bleaching cycles experienced by the coarser quartz grains which are likely originated from a more proximal site. However, caution must be made in interpreting the difference in luminescence sensitivity observed in Fig. 3c as there is a lack of knowledge about the effect of the surface to volume ratios of these grain sizes on the luminescence. Furthermore, the effect of the difference in the type and history of irradiation experienced by grains of different sizes must also be considered. Therefore the comparison data for varying grain size fractions presented in this paper should be viewed as an appeal for a deeper understanding of the luminescence sensitivity of detrital quartz.
Recently, Sharma et al. (2017) examined quartz samples from various sedimentary environments using a range of spectroscopic devices in addition to the TL and OSL measurements. They found that the OSL sensitivity and water content in quartz are negatively correlated. Our current data do not allow us to link the low quartz OSL sensitivity in loess and high OSL sensitivity in pedocomplex units with their respective water content in the crystal structure. Nevertheless, the observed consistent contrast between loess and paleosol provides an ideal pair of samples for advancing our understanding of the variations in luminescence sensitivity of sedimentary quartz using the approach employed by Sharma et al. (2017).
. CONCLUSIONS
Luminescence sensitivity of sedimentary quartz to radiation has been measured for the Khonako and Darai Kalon loess sections in southern Tajikistan, Central Asia. Both sections display variations with higher values in the pedocomplex units and lower values in the loess units. Similar trends are found between the luminescence sensitivity and proxies that display glacial-interglacial climate changes. Thermal activation experiments show that quartz in loess and pedocomplex samples have different characteristics, which is most likely related to the source changes. Repeated bleaching/irradiation cycles in the laboratory cause stronger sensitization in loess than in pedocomplex samples. The primary cause for the observed systematic difference in quartz luminescence properties is the climate-controlled changes in the composition of the weathering products from different source rocks. This mechanism emphasizes a process taking place in the same source area where the rate of weathering varies under glacial and interglacial climates and with different rocks. During the subsequent storage and transfer stages prior to deposition, the variations in irradiation-burial-exposure cycles which can cause sensitization of quartz luminescence sensitivity are also affected by local climate changes. Although this study sets out to understand the mechanisms underlying the linkage between the observed quartz luminescence characteristics in Tajik loess and climate changes, it highlights the complexity in the production and propagation of signals in source areas through a sedimentary system and calls for more investigations on the modification of provenance signals and environmental signals in the seemingly simple loess deposition system.